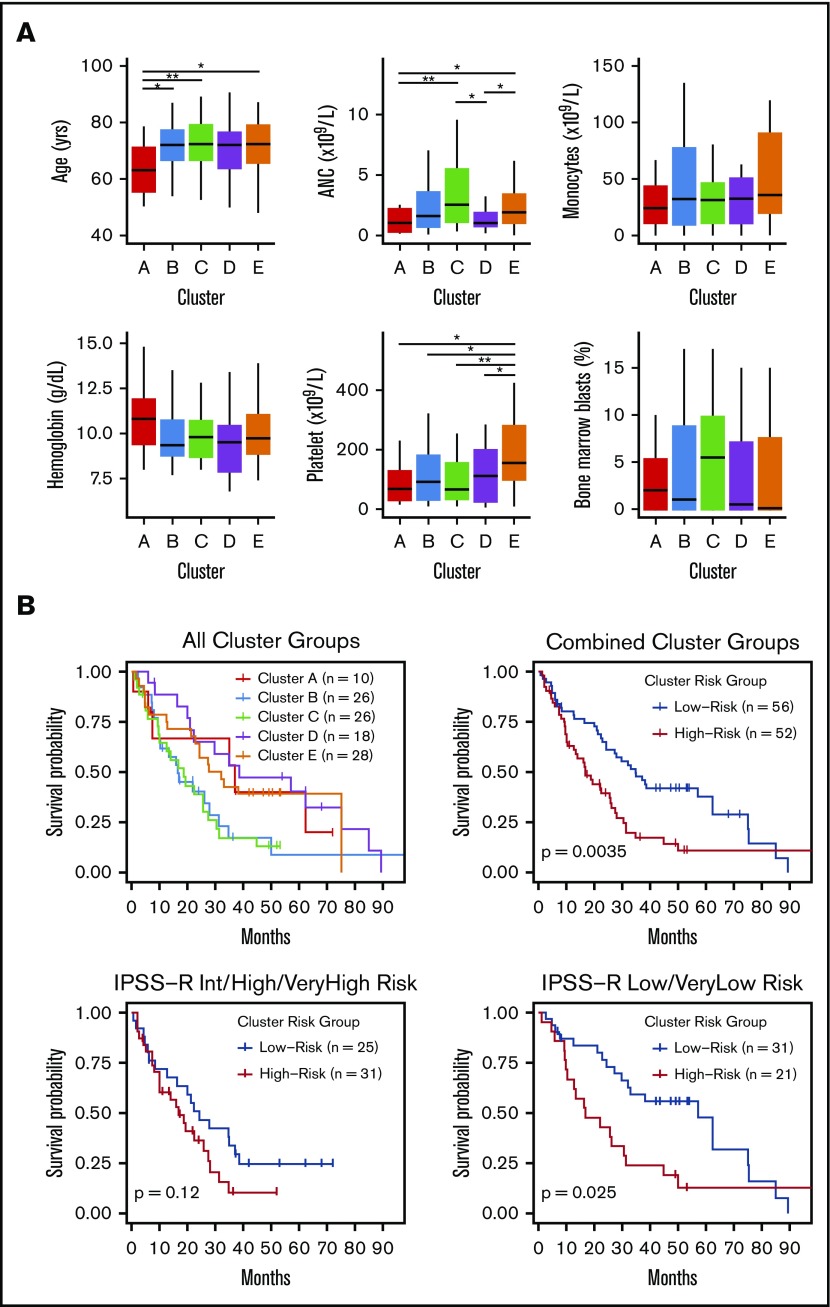
Figure 3.
Differences in clinical features and median survival are seen between methylation clusters. (A) Median with ranges (25th to 75th percentiles) are shown for patient age, absolute neutrophil count (ANC), absolute monocyte count, hemoglobin, platelet count, and bone marrow blast percentage. Variables with significant pairwise comparisons between clusters by Wilcoxon rank-sum test are indicated. *P < .05; **P < .01. (B) Kaplan-Meier (KM) curves stratified by methylation cluster are shown for all patients with available survival data (top left). KM curves for combined cluster risk groups are shown, where the “high-risk” patients are those in clusters B and C, and the “low-risk” patients are those in clusters A, D, and E (top right). KM curves for patients with intermediate, high, or very high IPSS-R risk are stratified by cluster risk groups (bottom left), and KM curves for patients with Low or Very low IPSS-R risk are stratified by cluster risk groups (bottom right).

