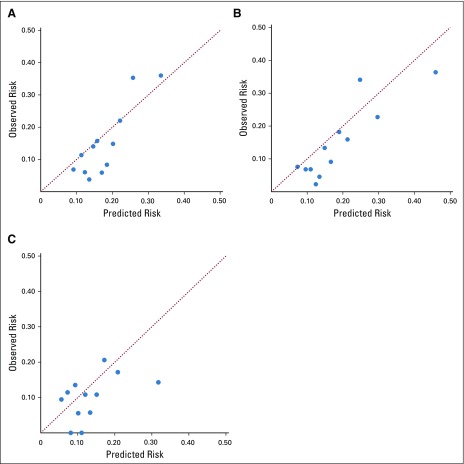
FIG 1.
Calibration of models for classification of hospitalization risk within the validation cohort. (A) Day 1 parsimonious model; (B) day 1 expanded model; (C) day N model. Each point represents a nonoverlapping stratum of patients ordered by predicted risk for hospitalization. The diagonal line represents perfect calibration, where observed risk and predicted risk are identical. The day 1 parsimonious and expanded models predict risk of hospitalization in the 30 days after initial chemotherapy treatment (day 1). The day N model predicts risk of hospitalization in the 30 days following a subsequent treatment visit occurring 15 to 22 days after day 1.

