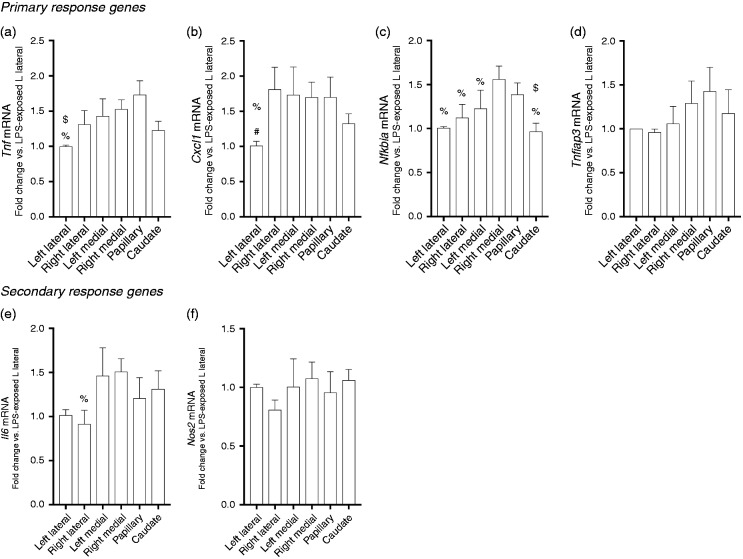
Figure 5.
LPS-induced primary response gene expression varies significantly by lobe at 5 h of exposure. LPS-induced fold change of primary and secondary response genes relative to left lateral lobe. Expression following 5 h of exposure of the primary response genes (a) Tnf, (b) Cxcl1, (c) Nfkbia, and (d) Tnfaip3 and secondary response genes (e) Nos2 and (f) Il6. Values are means ± SE (n = 9/time point). *P < 0.05 vs. left medial lobe; †P < 0.05 vs. caudate process; $P < 0.05 vs. papillary process; #P < 0.05 vs. right lateral lobe; %P < 0.05 vs. right medial lobe; by Kruskal-Wallis test.

