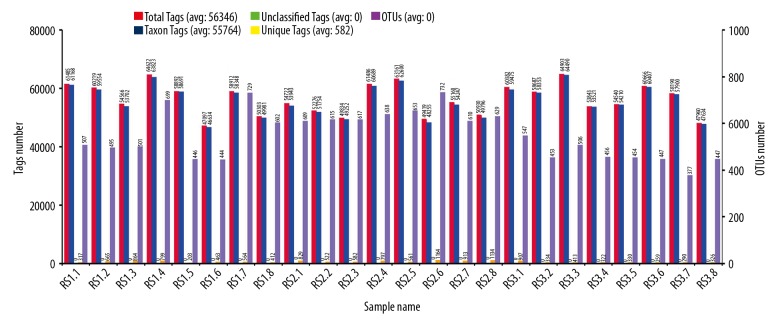
Figure 1.
Statistical chart for the bacterial OTUs clustering and species annotation of 24 fecal samples. RS1.1–RS1.8 represents post-cholecystectomy syndrome patients, RS2.1–RS2.8 represents asymptomatic post-cholecystectomy syndrome patients, and RS3.1–RS3.8 represents healthy people. The horizontal ordinate represents the 24 fecal samples. The first longitudinal ordinate represents the amounts of Tags. Total Tags (red, number of total gene sequences) represent the effective data. Unique Tags are displayed in orange and represent the number of Tags that cannot cluster to OTUs. Taxon Tags (blue, number of species annotated gene sequences) represent the effective data that were successfully obtained from the species annotation information. Unclassified Tags (green tea color) represent the number of Tags that have not obtained species annotation information. The second longitudinal ordinate represents the number of OTUs. OTUs (purple) represent the OTU amounts in each fecal sample, also named as amounts of bacterial species annotation.

