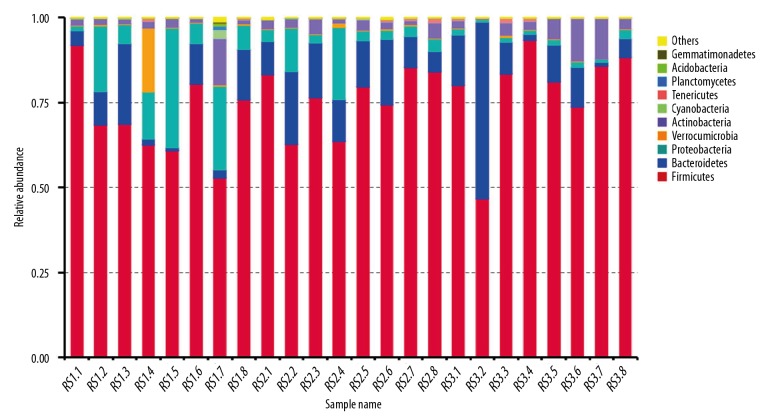
Figure 2.
Relative abundance of species in a cylindrical accumulative graph of bacteria in 24 fecal samples. RS1.1–RS1.8 represents post-cholecystectomy syndrome patients, RS2.1–RS2.8 represents asymptomatic post-cholecystectomy syndrome patients, and RS3.1–RS3.8 represents healthy people. The horizontal ordinate represents the 24 fecal samples. The longitudinal ordinate represents the relative abundance of species. Others represent the sum of the relative abundance in the other bacteria except for the above top 10 species.

