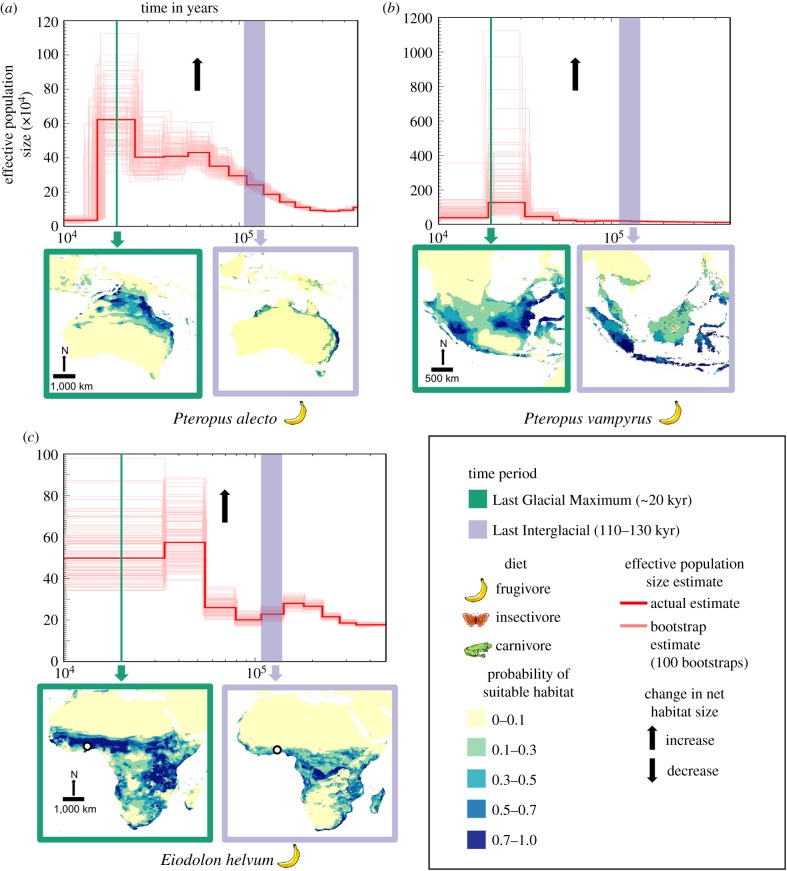
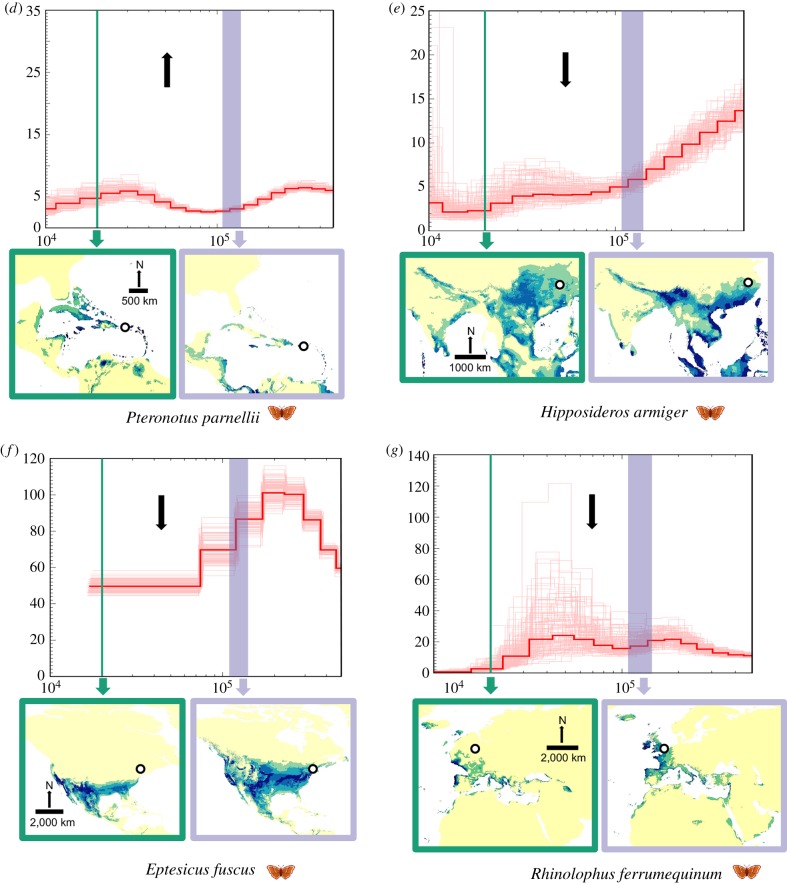
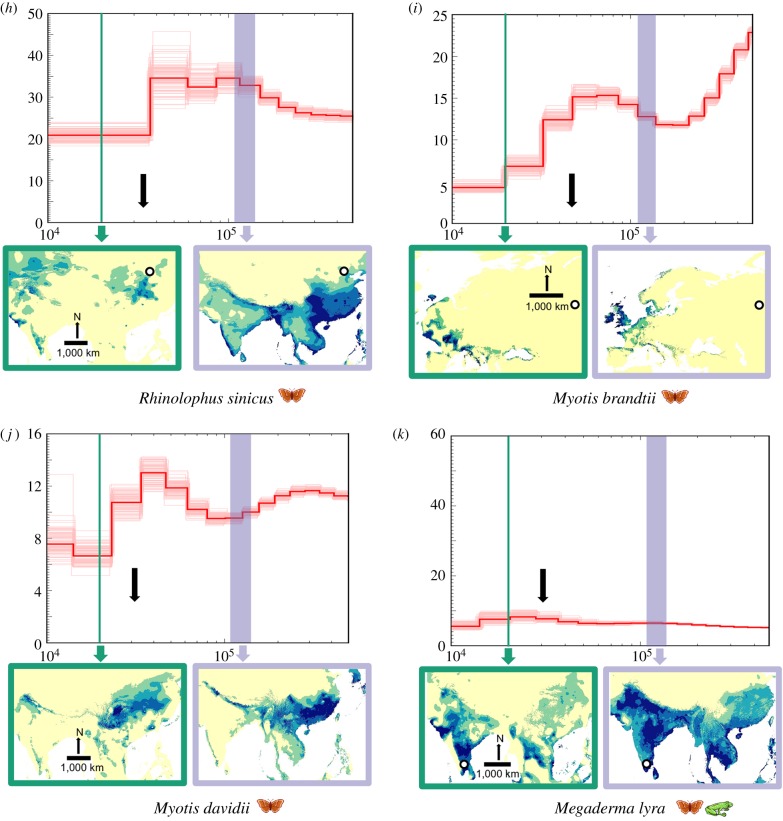
Figure 1.
Temporal fluctuations in effective population size (Ne) between approximately 400 000 and 10 000 years before present, with extent of suitable habitat mapped for the Last Interglacial (LIG) and the Last Glacial Maximum (LGM), respectively. Black arrows indicate estimated net change in suitable habitat availability based on the ecological niche models from the LIG to the LGM (see table 2 for more details). We assumed a generation time of 2 years and a mutation rate of 2.2 × 10⁻⁹ per base pair per year for all PSMC plots. (a–d) Species with a relatively high Ne leading to the LGM along with concomitant increase in habitat. (e–j) Species with a relatively low Ne and decrease in habitat leading to the LGM. Megaderma lyra (k) shows a slight increase in Ne and decrease in habitat leading to the LGM. Collection localities for bat genomes are mapped using a white circle with black margin whenever available (see the electronic supplementary material, table S1 for more information). (Online version in colour.)


