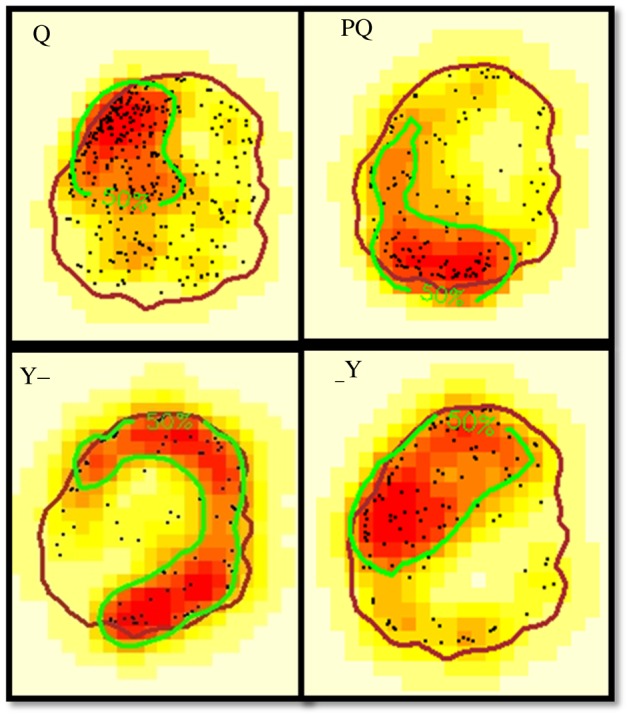
Figure 1.

Kernel density estimation maps showing the core areas depicted for the queen, PQ and two workers in nest v57. The dots denote the locations occupied by the wasps in the 3 days, and the brown boundary denotes the nest boundary. (Online version in colour.)
