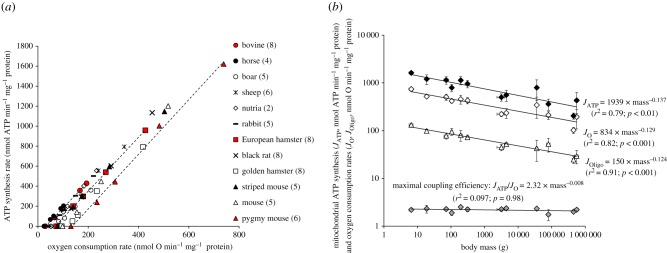
Figure 1.
Body mass dependence of mitochondrial oxidative phosphorylation activity and efficiency. (a) Relationships between the rates of ATP synthesis and oxygen consumption in muscle mitochondria isolated from mammals of different body mass. Red symbols illustrate the linearity of the relationships for three mammal species taken to cover the whole range of body mass (bovine with the highest mass, pygmy mice with the lowest mass and European hamster with an intermediate mass). Values are means from (n) independent mitochondrial preparations; (n) is given alongside the name of the species. Error bars (s.d.) are omitted for clarity but were on average 19% for maximal oxygen consumption (ranging from 7% in mice to 47% in sheep) and 25% for maximal ATP synthesis rate (ranging from 9% in pygmy mice to 46% in sheep). (b) Relationships between body mass and maximal ATP synthesis rate (JATP, black diamonds; F1,10 = 20.54; p < 0.01), maximal phosphorylating oxygen consumption (JO, white diamonds; F1,10 = 32.17; p < 0.001), oligomycin-induced basal non-phosphorylating oxygen consumption (JOligo, white triangles; F1,10 = 49.49; p < 0.001) and maximal coupling efficiency (JATP/JO, grey diamonds; not significant) of muscle mitochondria from mammals. Values are means ± s.d. (Online version in colour.)

