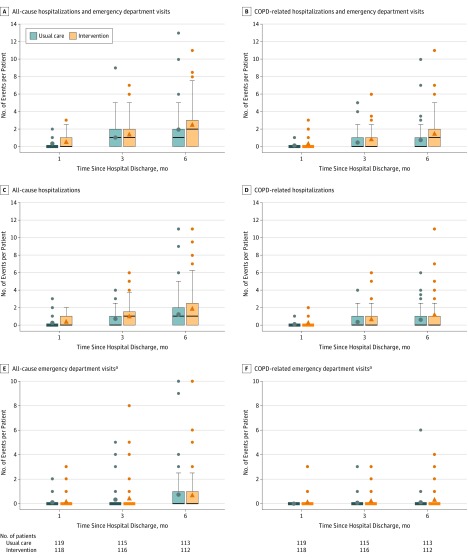
Figure 3. Cumulative Number of Chronic Obstructive Pulmonary Disease (COPD)–Related and All-Cause Events per Participant by Event Type and Study Group at 1, 3, and 6 Months After Discharge.
The boxes in the graphs show the median and interquartile range (IQR) of the data, with the bottom and top indicating the 25th and 75th percentiles, respectively; the upper whisker extends from the top of the box to the largest value no further than 1.5 times the IQR. The bottom whiskers extend from the bottom of the boxes to the smallest value no further than 1.5 times the IQR; outliers outside the whiskers range are also presented (dots). The circles and triangles indicate the mean number of events for usual care and the intervention, respectively. The black lines across the boxes indicate the median. Boxplots at each time point are staggered to avoid superimposition. Boxplots do not show when the 75th percentile of all data is zero. Whiskers do not show when all data points except for outliers are at zero.
aEmergency department visits that led to a hospitalization are not included in the emergency department visit counts.

