Figure 1.

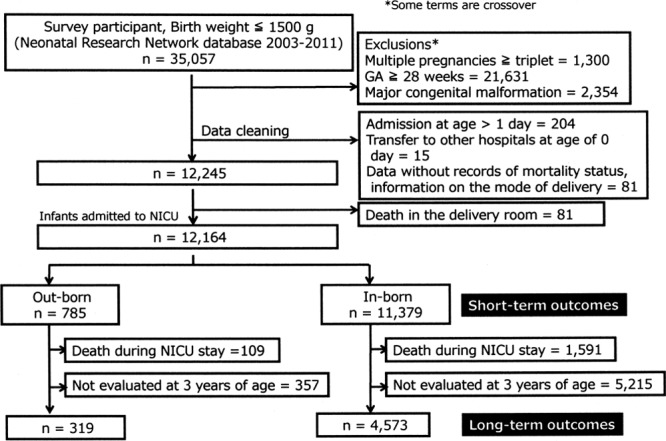
Flow chart of study population. Analyzed data (n = 12,164) were obtained from the Neonatal Research Network of Japan database (2003–2011). GA = gestational age, NICU = neonatal ICU.

Flow chart of study population. Analyzed data (n = 12,164) were obtained from the Neonatal Research Network of Japan database (2003–2011). GA = gestational age, NICU = neonatal ICU.