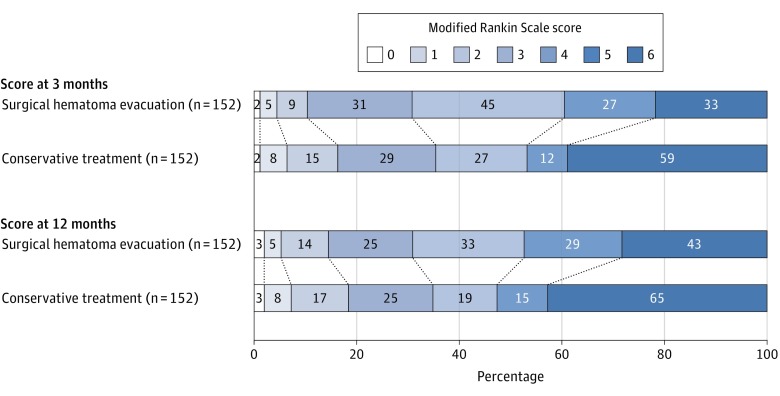
Figure 2. Distribution of Modified Rankin Scale Scores at 3 and 12 Months for the Propensity Score–Matched Cohort.
The modified Rankin Scale (mRS) scores range from 0 (indicating no deficit) to 6 (death). Each cell corresponds with a score on the mRS; the width of the cell indicates the proportion of patients with equivalent scores, and the number of patients is shown within the cell. The diagonal line between the 2 study groups indicates the comparison of outcome in each severity stratum. Statistical analyses compared scores (mRS 0-3 vs 4-6 and mRS 0-5 vs 6) according to treatment exposure with corresponding significance level (χ2 model). Favorable outcome was defined as a score of 0 to 3 (3 indicates being able to walk independently with a walker or a cane).

