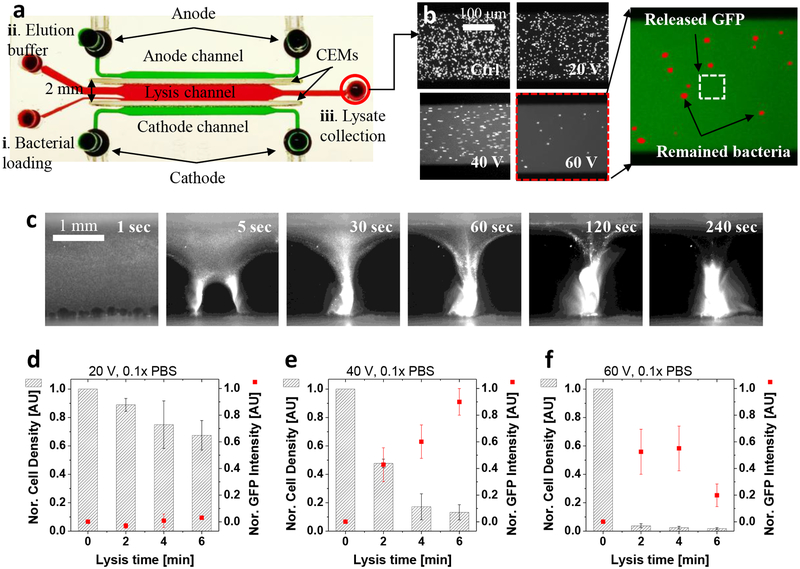
Figure 2.
Quantification of the lysis efficiency (bacterial removal rate) and lysate yield (GFP recovery rate). a, Experimental setup for the quantification. The batch-mode electromechanical lysis followed three steps: i) bacterial loading and lysis, ii) elution of lysates and un-lysed remaining cells, and iii) collection and quantification by fluorescent signals and image processing. b, Fluorescent microscopic images after the electromechanical lysis in various operational conditions. The lysis efficiency was quantified by comparing bacterial number before and after the lysis (red dots) while the lysate yield was calculated by measuring released GFP intensity (green fluorescent signals in background fluids). The lysis results in various electric potentials obtained in the same operational time (4 min). c, The time-laps images were in-situ observation of the lysis, starting from homogeneously distributed bacterial cells, and leading to fully-lysed concentrated GFP plugs (refer Video S1). d–f, Quantitative lysis results in various electric potentials and operational time, which exhibited three dominant ranges: insufficient (d), appropriate (e), and excessive (f). The excessive lysis condition showed high lysis efficiency but the GFP yield was reduced, while the GFP yield was the maximal at an appropriate condition (40 V, 6 min). The cell density was normalized by the input (0 min) cell number while the GFP intensity was normalized by the maximal GFP recovery value in the lysis experiments. The error bars in Fig. 2d–f were obtained by triplicated experiments.

