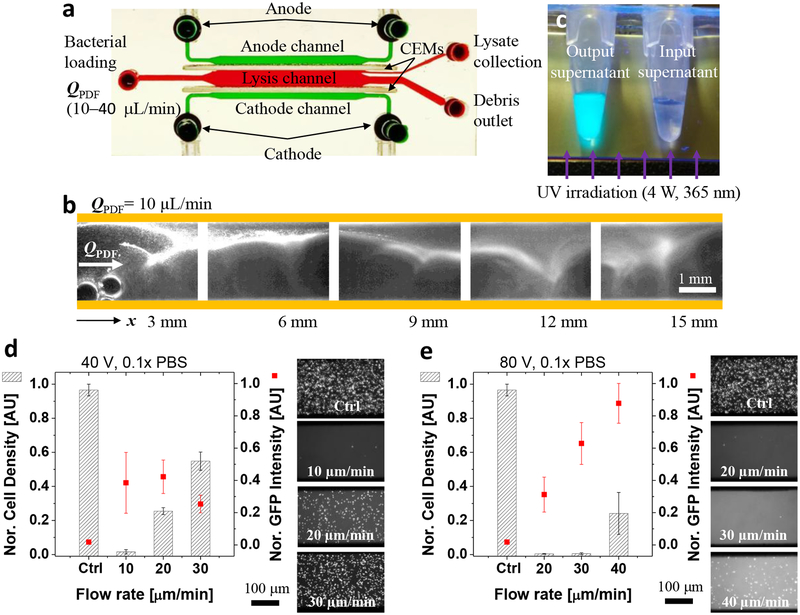
Figure 3.
Continuous electromechanical lysis of bacterial cells. a, Experimental set-up for the continuous lysis operation. A constant pressure driven flow (10–40 μL/min) was applied to deliver a fresh bacterial solution and flushed lysates toward downstream, while an electric field generated ICP phenomena at the lysis channel for continuous bacterial lysis. b, Fluorescent microscopic images along the lysis channel. The GFP-expressing bacterial cells underwent chaotic electroconvective vortices and electric fields along the lysis channel, leading to gradual bacterial lysis and recovery of GFP. c, Collected GFP and other lysates using the continuous lysis. The supernatant solution of the lysis output exhibited strong fluorescent intensity under a UV irradiation (4 W, 365 nm) while the supernatant of the input solution showed no distinguishable fluorescent signals. Both supernatant solutions were obtained after centrifugation at 5000 rpm for 3 min to eliminate the GFP signal from live bacterial cells. d,e, Quantification of the continuous lysis performance. The stronger electric potential (e, 80 V) allowed higher flow rates of a bacterial solution than the lower one (d, 40 V), resulting in higher lysis throughput and GFP recovery rate. The cell density was normalized by the input (Ctrl) cell number while the GFP intensity was normalized by the maximal GFP recovery value in the lysis experiments. The error bars in Fig. 3d,e were obtained by triplicated experiments.

