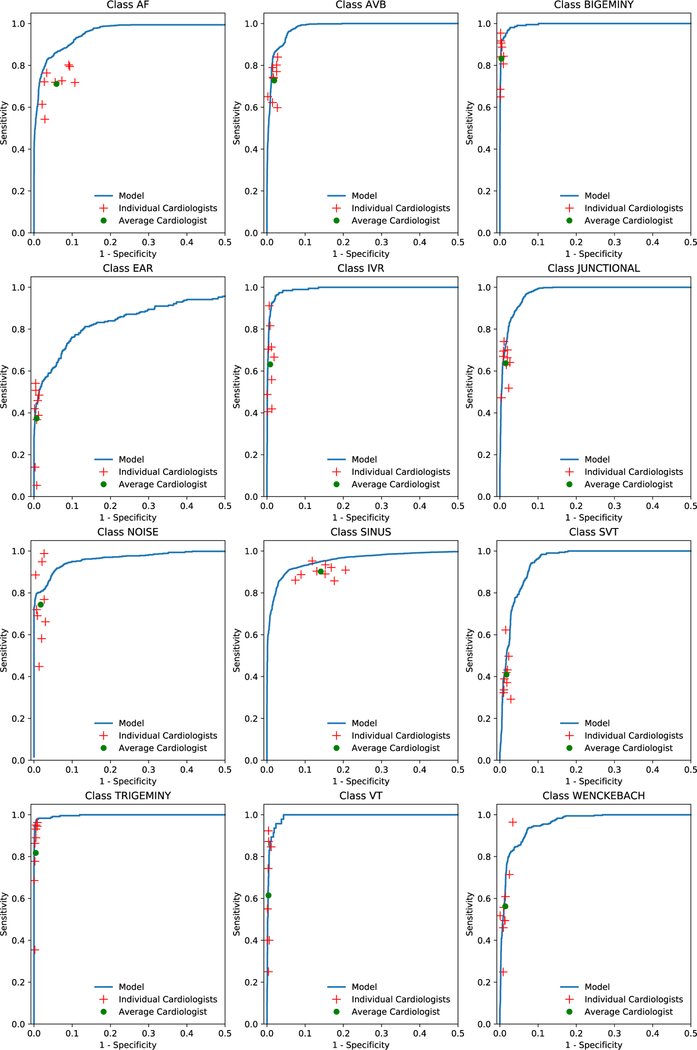
Extended Data Fig 2:
Receiver operating characteristic curves for deep neural network predictions on 12 rhythm classes. Individual cardiologist performance is indicated by the red crosses and averaged cardiologist performance is indicated by the green dot. The line represents the ROC curve of model performance. AF-atrial fibrillation/atrial flutter; AVB-atrioventricular block; EAR-ectopic atrial rhythm; IVR-idioventricular rhythm; SVT-supraventricular tachycardia; VT-ventricular tachycardia. n = 7,544 where each of the 328 30-second ECGs received 23 sequence-level predictions.

