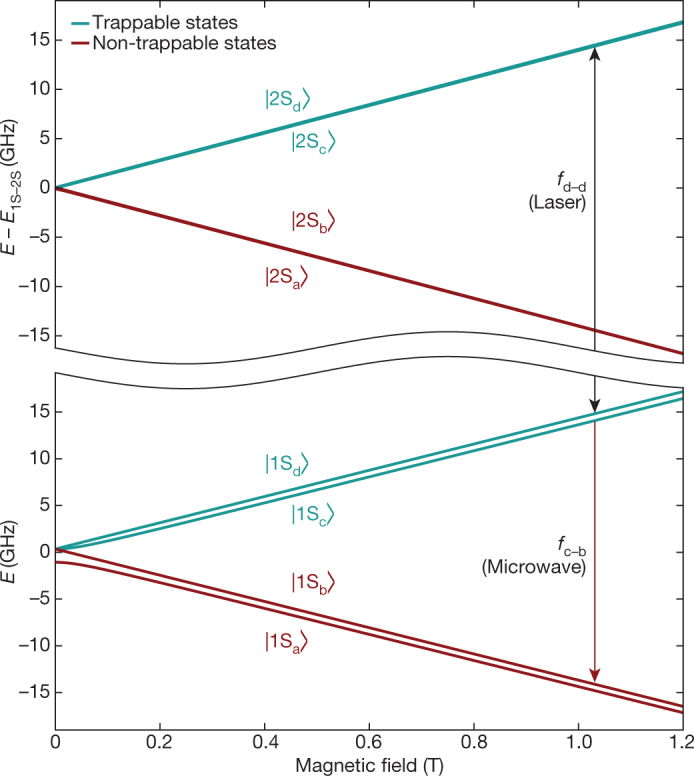
Fig. 2. Hydrogenic energy levels.

Calculated energies (E; for hydrogen) of the hyperfine sublevels of the 1 S (bottom) and 2 S (top) states are plotted against magnetic field strength. The centroid energy difference E1S–2S = 2.4661 × 10¹⁵ Hz has been suppressed on the vertical axis. The vertical black arrow indicates the two-photon laser transition probed here (frequency fd–d); the red arrow illustrates the microwave transition used to remove the 1Sc state atoms (frequency fc–b).
