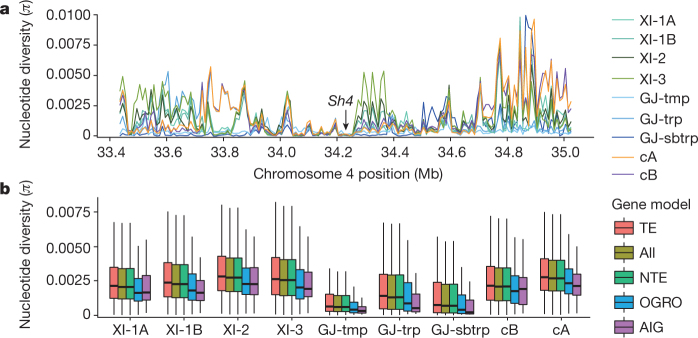
Fig. 2. Nucleotide diversity.
a, Differential nucleotide diversity between subpopulations at the Sh4 locus on chromosome 4 using 10-kb sliding windows. b, Box plots of the distribution of π in 100-kb regions surrounding gene models across the genome. Box plots are shown for k = 9 subpopulations for all 100-kb windows (All) (n = 3,728 in total) and those containing genes annotated as transposable elements (TE) (n = 3,305 windows), NTE (n = 3,709), from the OGRO/QTARO database (OGRO) (n = 828) and the subset of 78 domestication-related genes (AIG) (n = 61 windows). Box plots show the median, box edges represent the first and third quartiles, and the whiskers extend to farthest data points within 1.5× interquartile range outside box edges.

