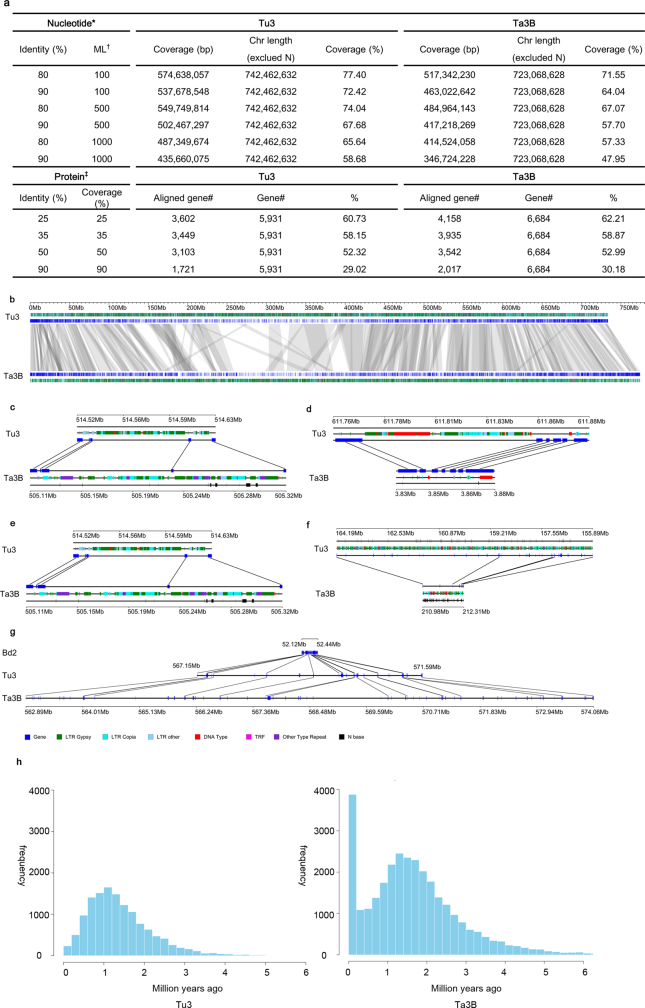
Extended Data Fig. 8. Comparison of chromosome 3 of Tu with chromosome 3B of Ta.
a, Comparison of Tu3 with Ta3B at both nucleotide and protein levels. *Nucleotide: minimum cutoff of DNA sequence alignments between Tu3 and Ta3B. †ML, minimum length (bp) to align. ‡Protein: minimum cutoff of protein sequence alignments between Tu3 and Ta3B, and in reverse. b, Overall view of syntenic blocks between Tu3 and Ta3B. c, A syntenic block composed of five consecutive collinear gene pairs, showing large repeat insertions on Ta3B of >100 kb. d, A syntenic block composed of seven consecutive collinear gene pairs. A 70-kb contraction is seen in Ta3B. e, A syntenic block with eight collinear genes interrupted by non-syntenic genes. f, Two segments of Tu3 and Ta3B show five discrete collinear gene pairs and gene expansions in Tu3. g, Genome expansion in one representative syntenic block from Bd2 (0.3 Mb), Tu3 (4.4 Mb), and Ta3B (11.2 Mb). Compared with the Tu3 segment, large numbers of non-homologous genes and repeats can be observed in Ta3B, resulting in a 7-Mb expansion. h, Insertion dates of LTR retrotransposons on Tu3 and Ta3B. A recent retrotransposon burst at around 0.1 Ma is observed on Ta3B but not on Tu3.

