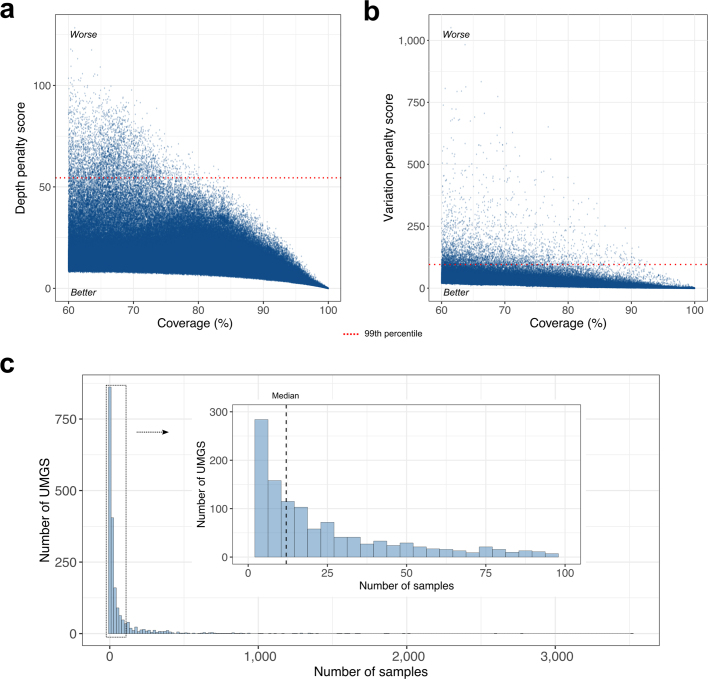
Extended Data Fig. 7. Defining genome presence and prevalence distribution.
a, b, Depth (a) and variation (b) penalty scores plotted against the level of genome coverage of the 1,952 UMGS across all 13,133 metagenomic samples. The depth penalty score was calculated by multiplying the missing coverage (100 − genome coverage) by the log-transformed mean read depth. The variation penalty score was based on the missing coverage multiplied by the depth coefficient of variation (standard deviation of read depth divided by the mean). Dashed red lines correspond to the 99th percentile, set as the upper threshold used to define genome presence. c, Number of UMGS detected in the corresponding number of metagenomic samples. The distribution of UMGS found in up to 100 samples is illustrated as an inset. The vertical dashed line represents the median value of all data.

