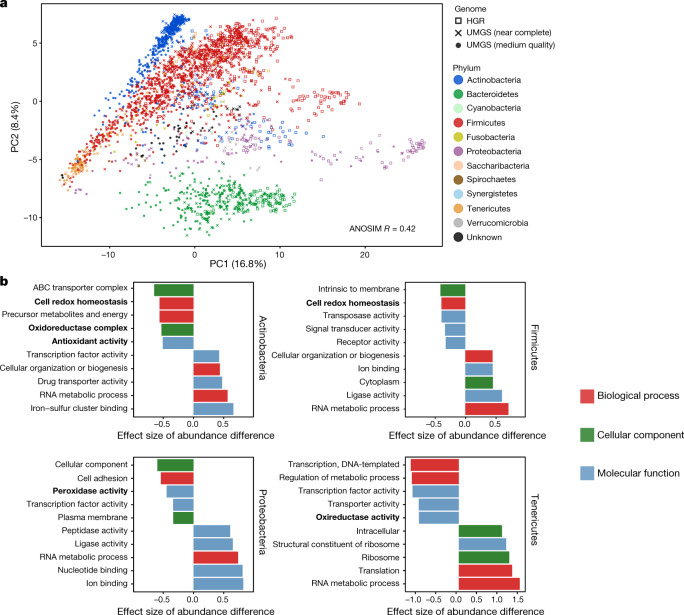
Fig. 5. The uncultured species have a distinct functional capacity.
a, Principal component analysis (PCA) based on GPs of the HGR (n = 553 genomes) and the UMGS (n = 1,952 genomes) coloured by phylum. b, GO functions differentially abundant between the HGR and UMGS genomes from Actinobacteria, Firmicutes, Proteobacteria and Tenericutes. The five functions with the highest and lowest effect size of abundance difference with a false discovery rate (FDR) <5% are represented. A positive effect size denotes overrepresentation in the UMGS genomes. GO terms related to redox functions are highlighted in bold.

