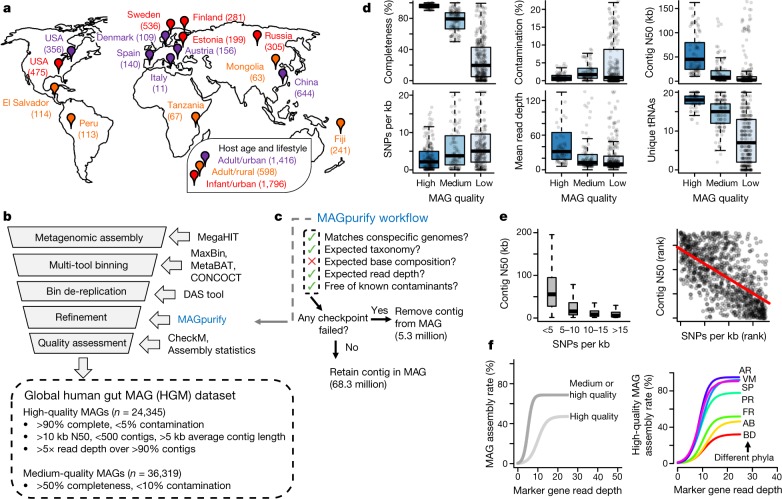
Fig. 1. Recovery of genomes from globally distributed gut metagenomes.
a, Geographical distribution of metagenomes. Sample sizes are indicated in parentheses, and pin colour indicates the majority age group and lifestyle (infants, ≤3 years old; adults, ≥18 years old). Several locations are represented by multiple studies; several studies were conducted in multiple locations. b, Computational pipeline for assembling MAGs. c, Pipeline for identifying and removing incorrectly binned contigs. d, Quality metrics across low- (n = 101,651), medium- (med., n = 36,319) and high-quality (n = 24,345) MAGs. e, Barriers to MAG recovery. Single nucleotide polymorphisms (SNPs) were called for MAGs with sufficient read depth (n = 17,671), and compared with N50. Red line is from a Spearman correlation (ρ = −0.61). f, At least 10–20× depth is required to assemble a MAG, but assembly rates vary between taxa. AB, Actinobacteria; AR, Archaea; BD, Bacteroidetes; FR, Firmicutes; VM, Verrucomicrobia; PR, Proteobacteria; SP, Spirochaetes. Sequencing read depth was estimated using IGGsearch (see Methods), and curves were fit using logistic regression. For box plots, the middle line denotes the median; the box denotes the interquartile range (IQR); and the whiskers denote 1.5× IQR.

