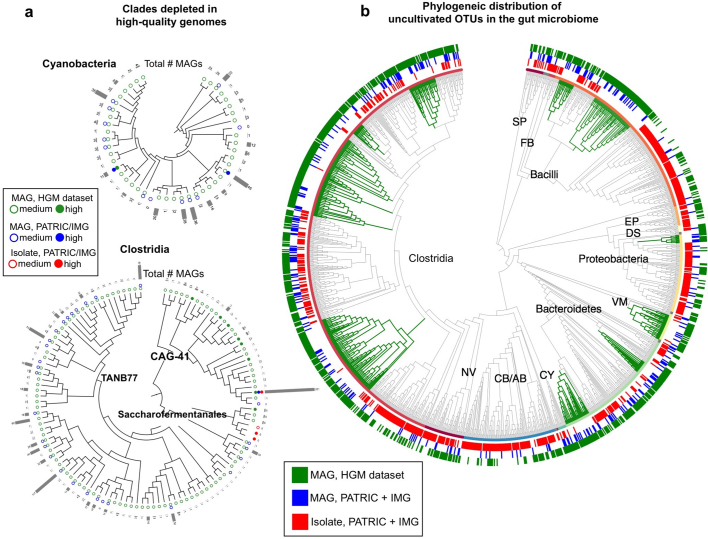
Extended Data Fig. 7. Large lineages are depleted in high-quality genomes and isolate genomes.
a, The trees indicate the phylogenetic distribution of species-level OTUs from the human gut for Cyanobacteria, and a subclade within Clostridia. All OTUs within the Cyanobacteria phylum were assigned to the Melainabacteria class. Each tip indicates one species-level OTU. Circles indicates whether a medium- (open circle) or high-quality genome (closed circle) was recovered for MAGs from the HGM dataset (green), MAGs from PATRIC + IMG datasets (blue) or isolate genomes from PATRIC + IMG datasets (red). Diversity within these clades would have been missed without the inclusion of medium-quality MAGs. b, The tree indicates the phylogenetic distribution of bacterial genus-level OTUs from the human gut (n = 1,321 OTUs). The outer rings indicate whether an OTU contains a MAG from the HGM dataset (green), a MAG from PATRIC + IMG dataset (blue) or an isolate genome from PATRIC + IMG dataset (red). Labels indicate phyla. Large monophyletic clades that are depleted in isolate genomes are highlighted with green branches.

