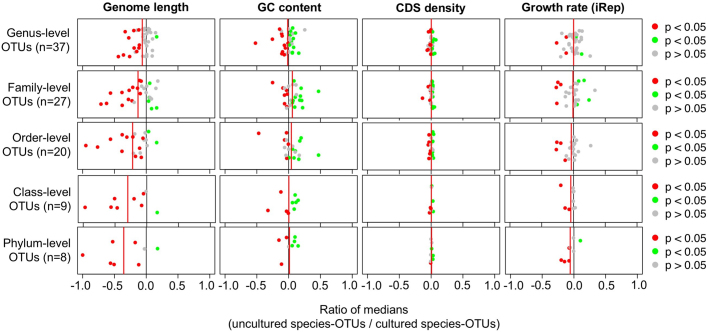
Extended Data Fig. 8. Genome size consistently differs between MAGs from cultivated and uncultivated species-level OTUs, but other features do not.
Each column indicates one genomic feature (genome size, GC content, coding density and growth rate) that was compared between high-quality MAGs (n = 24,345) from cultivated species-level OTUs (n = 233) and MAGs from uncultivated species-level OTUs (n = 271). To reduce redundancy, genomic features were averaged across all MAGs per species-level OTU. The value of each point in the figure indicates the log2 ratio of each genomic feature between uncultivated species-level OTUs and cultivated species-level OTUs. Each point indicates a single OTU at a higher taxonomic rank, with the rank indicated by row labels (only including higher-rank OTUs with at least ten cultivated and ten uncultivated species-level OTUs). Red and green points indicate whether the distribution of a genomic feature was significantly different between groups based on a two-sided Wilcoxon rank-sum test after correction for multiple hypothesis tests (α = 0.05). For example, a value of −1.0 at the phylum level for genome size indicates that the genome size of MAGs within uncultivated species was 2× smaller than for cultivated species within a single phylum. Overall, MAGs from uncultivated species had consistently smaller genomes across taxonomic groups regardless of the taxonomic rank, whereas other genomic features (GC content, coding density and growth rate) did not consistently or systematically differ.

