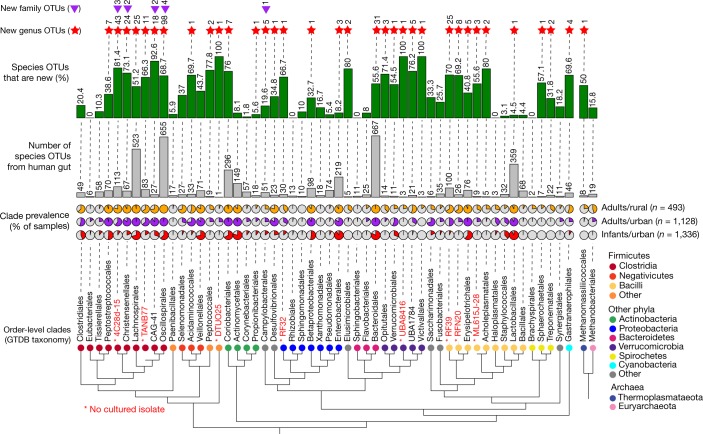
Fig. 3. Newly identified gut species are broadly distributed across taxonomic groups.
Order-level clades with ≥10 human gut species-level OTUs or that were detected in ≥10% of metagenomes from healthy individuals. Taxonomic labels are based on the Genome Taxonomy Database (GTDB). Red labels indicate orders represented exclusively by MAGs (whether in the current study or from previous studies). Pie charts indicate the prevalence of orders across metagenomes from healthy individuals. Grey bars indicate the number of gut species-level OTUs per order, and the green bars indicate the percentage of OTUs that are newly identified in this study. Red stars and purple triangles indicate the number of newly identified genus-level and family-level OTUs, respectively.

