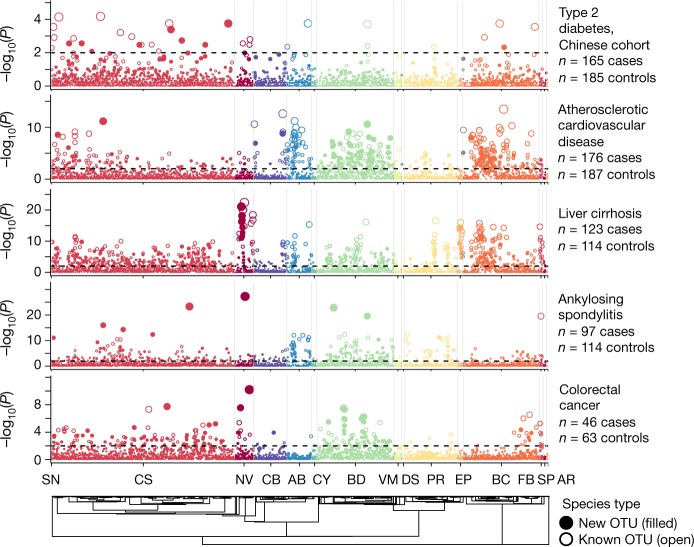
Fig. 4. Metagenome-wide association of gut OTUs with human diseases.
The Manhattan plot shows the phylogenetic distribution of species–disease associations for different metagenomic studies. Each point is one species-level OTU and point height indicates the P value from a two-sided Wilcoxon rank-sum test of estimated species abundance between diseased and healthy individuals after correction for multiple hypothesis tests. The dotted line indicates a false discovery rate of 1%. The plot shows results for five diseases with more than ten species–disease associations. Species are ordered according to their phylogeny, which is displayed at the bottom. AR, Archaea; AB, Actinobacteria; BC, Bacilli; BD, Bacteroidetes; CB, Coriobacteriia; CS, Clostridia; CY, Cyanobacteria; DS, Desulfobacteraeota; EP, Epsilonbacteraeota; FB, Fusobacteria; NV, Negativicutes; PR, Proteobacteria; SN, Synergistetes; SP, Spirochaetes; VM, Verrucomicrobia.

