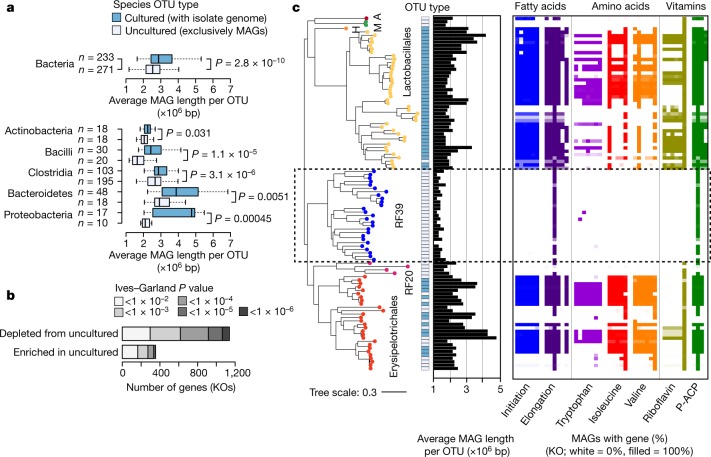
Fig. 5. Uncultured OTUs have reduced genomes and are missing common biological functions.
a, Comparison of genome size between cultivated and uncultivated species-level OTUs after correction for incompleteness and contamination. The middle line of the box plots denotes the median; the box denotes the IQR; and the whiskers denote 1.5× IQR. b, Genes from the KEGG database were compared between 233 cultivated and 271 uncultivated species-level OTUs using phylogenetic logistic regression. Most genes associated with cultivated status are depleted from uncultured OTUs. KO, KEGG orthology group. c, Phylogenetic tree of species OTUs from Bacilli that were detected in >1% of gut metagenomes. Tip labels and colours indicate order-level clades from the GTDB. A, Acholeplasmatales; M, ML615J-28; H, Haloplasmatales. RF39 has a highly reduced genome with numerous metabolic auxotrophies. P-ACP, pimeloyl-acyl-carrier protein.

