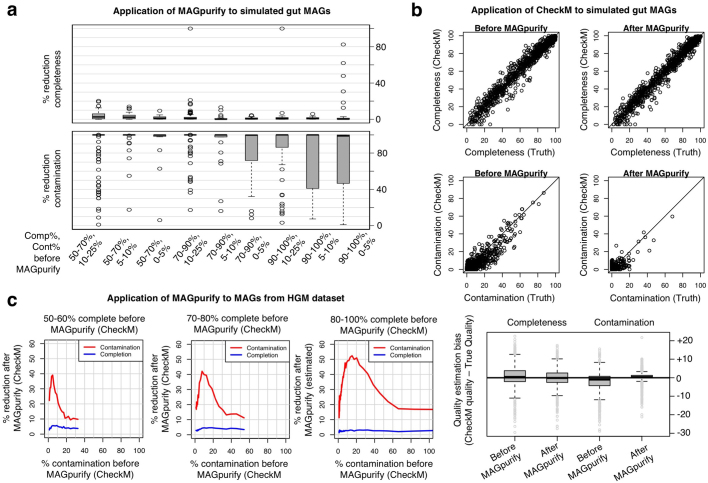
Extended Data Fig. 1. The MAGpurify tool removes contamination, maintains completeness and does not result in biased estimates of genome quality.
a, b, One thousand human gut MAGs were simulated to validate the MAGpurify pipeline. Each MAG contained two genomes: one host genome that represents the target genome, and one donor genome that represents the contaminating genome (Supplementary Table 7). All 102 input genomes were isolated from the human gut, and were estimated to have >95% completeness, <1% contamination and <25 contigs. MAGs were simulated with completeness, contamination and N50 on the basis of randomly sampled MAGs from the HGM dataset. Sixty-five MAGs in which contamination exceeded completeness (and thus the host genome was in the minority) were dropped from the analysis. a, The box plots indicate the percentage of reduction in completeness (top) and contamination (bottom) after applying MAGpurify. Regardless of initial quality, MAGpurify sensitively removed contamination for most MAGs, while avoiding removal of the host genome. b, CheckM was applied to simulated MAGs before and after applying MAGpurify. Top, the scatter plots show that true genome quality is correlated with the estimated genome quality before and after applying MAGpurify. Black lines indicate the line of equality. Bottom, the distribution of differences between true and estimated quality is centred at zero, which indicates that CheckM quality estimates are not biased after applying MAGpurify. c, MAGpurify was applied to all MAGs from the HGM dataset. The figure shows the reduction in CheckM quality estimates before and applying MAGpurify. Estimated quality improvement is greatest when completeness is between 90 and 100% and contamination is between 10 and 30%. In all box plots, the middle line denotes the median, the box denotes the IQR and the whiskers denote 1.5× IQR.

