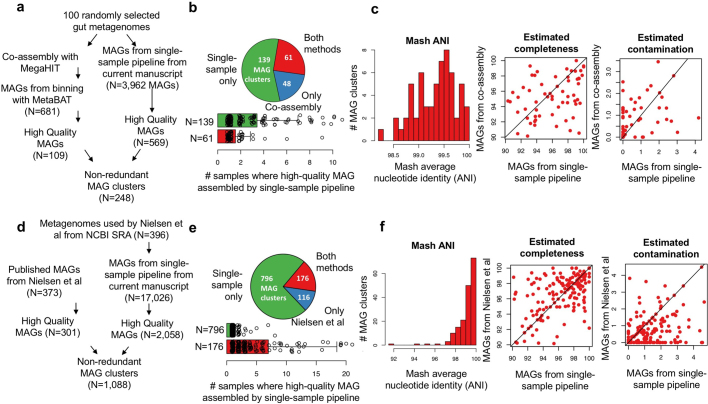
Extended Data Fig. 2. Single-sample assembly and binning yields more non-redundant, high-quality MAGs compared to other approaches.
a–c, Comparison of single-sample assembly and binning with co-assembly and binning. a, One hundred randomly selected human gut metagenomes were co-assembled with MegaHIT (v.1.1.4, options ‘–k-min 27–k-max 127–k-step 10–kmin-1pass–continue’), which took 3,608 central processing unit hours. Reads from each sample were mapped back to the co-assembly to quantify the read depth of each contig in each sample. This information was used as input to MetaBAT (v.2.12.1, default options) to generate MAGs. Other binning programs—including CONCOCT and MaxBin2—did not complete owing to the large size of the assembly. MAGs from the single-sample pipeline were grouped with MAGs from the co-assembly using Mash at 90% ANI to form 248 clusters. b, A large fraction of clusters is exclusively represented by MAGs from the single-sample pipeline. These clusters tend to be found in multiple samples, which may interfere with co-assembly. For bar plots, the centre bar indicates the mean, the error bar indicates the standard deviation and all data points are overlaid. c, The MAGs recovered by both pipelines (n = 61) have high ANI (which indicates that they are very similar genomes) and tend to have similar levels of estimated completeness and contamination, as determined by CheckM. Black lines indicate the line of equality. d–f, Comparison of single-sample assembly and binning with co-abundance binning (as previously performed20). d, MAGs from the single-sample pipeline were grouped with previously published MAGs20 using Mash at 90% ANI to form 1,088 clusters. e, A large fraction of clusters is only represented by MAGs from the single-sample pipeline, which tend to be restricted to individual metagenomes—this may be explained by the fact the previously published20 method requires MAGs to be present in multiple samples to accurately quantify co-variation and bin contigs. For bar plots, the centre bar indicates the mean, the error bar indicates the standard deviation and all data points are overlaid. f, The MAGs recovered by both pipelines (n = 176) have high ANI (which indicates that they are very similar genomes) and tend to have similar levels of estimated completeness and contamination, as determined by CheckM. Black lines indicate the line of equality.

