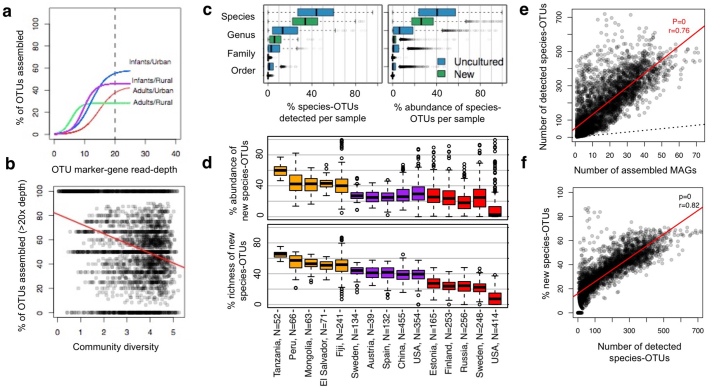
Extended Data Fig. 4. Assembly and distribution of MAGs across human populations.
IGGsearch was applied to 3,083 metagenomes from healthy individuals that were used for assembly and binning to estimate the abundance of human gut OTUs per sample. a, b, The overall assembly rate was computed at each read depth, defined as the percentage of detected OTUs with an assembled MAG. a, Curves were fit using logistic regression. Conditioning on read depth, MAGs are recovered more readily from an infant metagenome compared to an adult metagenome from a rural population. b, The x axis indicates the Shannon diversity of each of the 3,810 metagenomic samples, and the y axis indicates the MAG recovery rate for OTUs with >20× depth. MAGs are recovered less often from a high-diversity community, even when read-depth is sufficiently high (Pearson’s ρ = −0.31, P = 4.3 × 10−75). c, Relative abundance and richness of newly identified and uncultured OTUs at different taxonomic ranks across metagenomes from healthy individuals (n = 3,083). d, Data from c, but shown only for newly identified species-level OTUs and conditioned by host population. Only populations with at least 30 metagenomes are shown. Orange box plots indicate samples from adults in rural countries, purple from adults in urban countries and red from infants in urban countries. c, d, In box plots, the middle line denotes the median, the box denotes the IQR and the whiskers denote 1.5× IQR. e, IGGsearch sensitively detects the presence of species-level OTUs in samples from which no MAG was recovered. The x axis indicated the number of MAGs assembled and the y axis indicates the number of species-levels OTUs detected from IGGsearch profiling. Each point indicates one metagenomic sample (n = 3,083). The red regression line is from a Pearson correlation. The vast majority of detected species is not assembled into a MAG. f, Species richness versus the relative percentage of newly identified species-level OTUs across metagenomic samples (n = 3,083). The red regression line is from a Pearson correlation (ρ = 0.82, P = 0). Newly identified species-level OTUs comprise a greater percentage of the community when diversity is high. This pattern was robust after rarefying metagenomes to one million reads and using a prevalence-matched set of 1,000 newly identified species and 1,000 known species (ρ = 0.59, P = 0).

