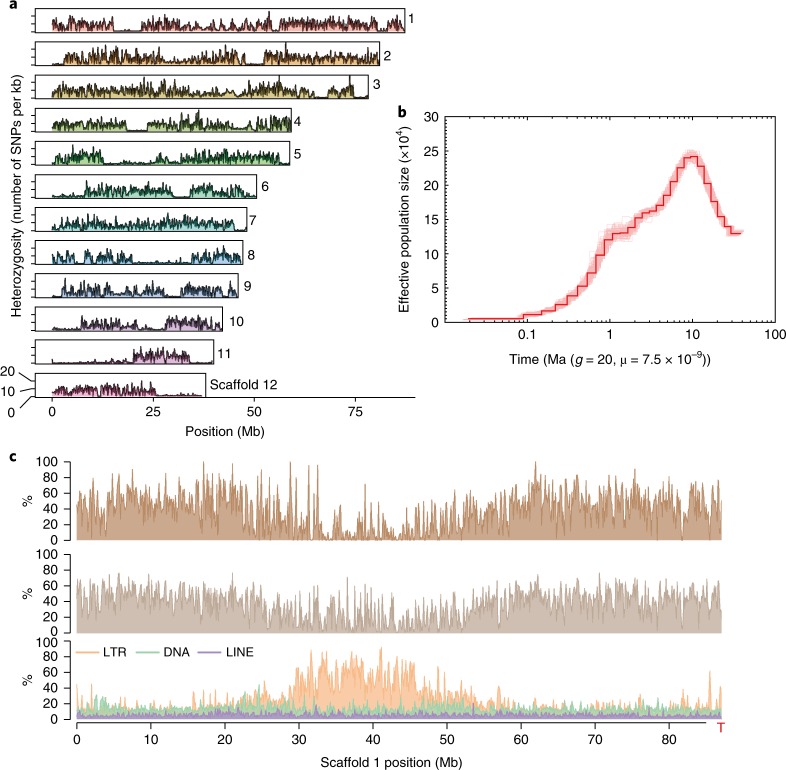
Fig. 1. SCT genome heterozygosity.
a, Number of heterozygous biallelic SNPs per 100-kb non-overlapping windows is plotted along the largest 12 scaffolds. Indels were excluded. b, The history of effective population size was inferred using the PSMC method. One hundred bootstraps were performed and the margins are shown in light red. c, For every non-overlapping 100-kb window, the distribution is shown from top to bottom: gene density (percentage of nucleotides with predicted model), transcriptome (percentage of nucleotides with evidence of transcriptome mapping) and three different classes of repetitive sequences (percentage of nucleotides with transposable element annotation). The red T letter denotes the presence of a telomeric repeat cluster at the scaffold end. LINE, long interspersed nuclear element.

