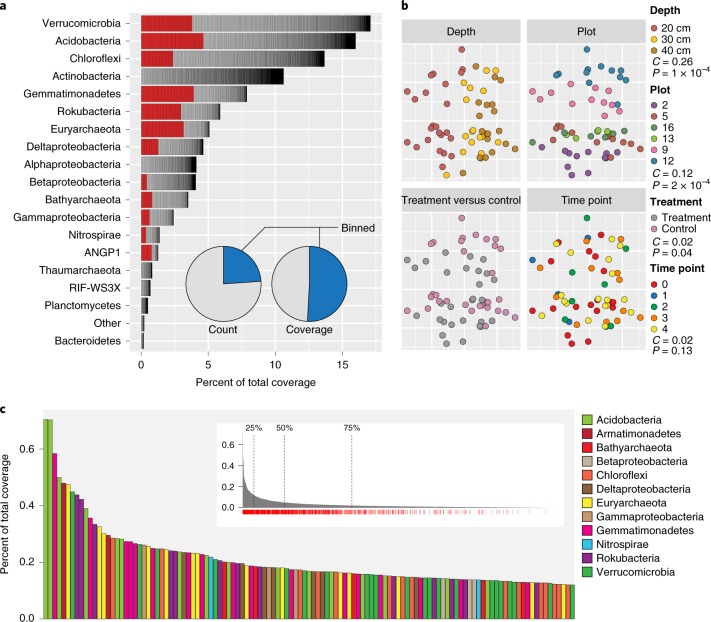
Fig. 1. rpS3 species group abundance, influence of variables and abundance metrics.
a, Percent of total coverage of all species groups (SGs) ranked by relative phylum coverage. ‘Other’ includes phyla with <5 SGs. Organisms in red are in the top 25% of organisms by coverage. Inset, pie charts showing the breakdown of SGs associated with genome bins (blue) based on count and coverage of SGs. b, NMDS plot (stress = 0.055) of SG UniFrac distances. The ordination is replicated and overlaid with the four data types collected across our 60 samples. Variable importance (C) and significance (P) calculated by an MRPP procedure are displayed in the key. c, Top 25% of SGs ranked by total coverage across all samples. Inset, full rank abundance curve showing the positions where 25%, 50% and 75% of the total data set coverage are reached. Red tick marks under the plot indicate SGs with bins. Also see Supplementary Table 5.

