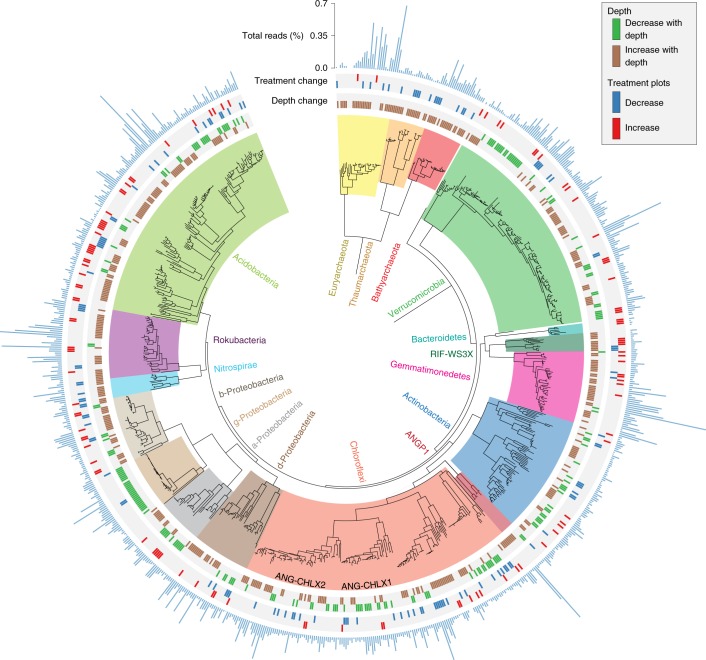
Fig. 2. Maximum likelihood tree of all near-complete genomes.
Phylogenetic tree constructed with a concatenated alignment of 15 co-located ribosomal proteins (L2, L3, L4, L5, L6, L14, L15, L16, L18, L22, L24, S3, S8, S17 and S19). The tree includes 722 bacterial and 71 archaeal genomes. The two Chloroflexi classes basal to classic Chloroflexi lineages are named. Concentric rings moving outward from the tree indicate if a genome’s associated SG abundance was found to significantly increase or decrease with depth and increase or decrease in plots under extended rainfall treatment at either 10–20 cm or 30–40 cm. For all genomes shown, the direction of response (increase or decrease) to extended rainfall treatment was never different between depths. The concentric bar plot indicates relative abundance (see Methods). For the complete ribosomal protein tree, see Supplementary Fig. 4 and Supplementary Data 5. For all exact relative abundance values and differential abundance statistics, see Supplementary Table 5.

