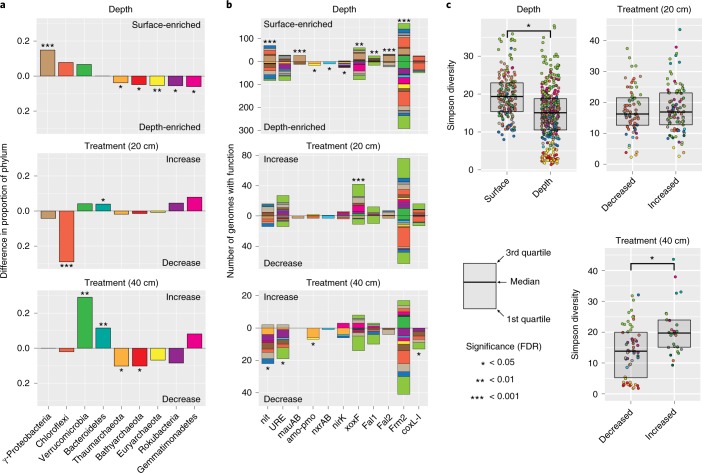
Fig. 4. Enrichment of phyla and metabolic functions across depth and treatment.
a, The difference in proportion of a phylum between genome groups that increase and decrease with depth/rainfall extension. Black asterisks indicate a significant enrichment of the phylum and bar direction indicates the genome set where the enrichment was found (two-sided permutation test: *false detection rate (FDR) ≤ 0.05, **FDR ≤ 0.01, ***FDR ≤ 0.001). b, Count of genomes encoding targeted carbon- and nitrogen-processing functions found to be significantly enriched in at least one comparison between genome groups that increase and decrease with depth/rainfall extension treatment. Genome counts only include those that were statistically different between depth or treatment shown. Black asterisks indicate a significant enrichment of the function and bar direction indicates the genome set where the enrichment was found (two-sided permutation test: *FDR ≤ 0.05, **FDR ≤ 0.01, ***FDR ≤ 0.001). Colours indicate phyla (see Fig. 3 for key). c, CAZy enzyme Simpson diversity distributions between genome groups that increase and decrease with depth/rainfall extension treatment. Simpson diversity has been transformed to the inverse form (1/(1 − Simpson)) for ease of viewing. Points are coloured by phylum (see Fig. 3 for key). A black asterisk between box plots indicates a statistical difference (two-sided Wilcoxon test: * FDR ≤ 0.05). Across all panels sample numbers were ndepth = 60 biologically independent samples, n20 cm treatment = 24 biologically independent samples and n40 cm treatment = 20 biologically independent samples. Across all panels the numbers of genomes analysed were ndepth = 570 independent genomes, n20 cm treatment = 173 independent genomes and n40 cm treatment = 85 independent genomes. All tests were corrected for multiple testing using FDR. For all exact FDR values, see Supplementary Tables 14–16.

