Fig. 3.
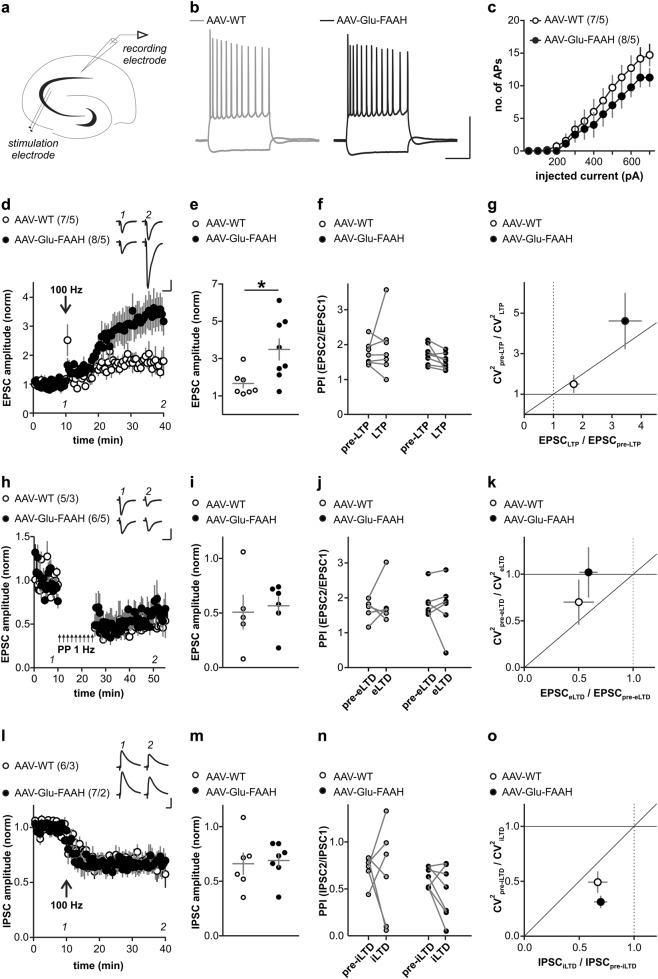
Long-term plasticity at hippocampal CA3-CA1 synapses. a Schematic drawing illustrates placement of stimulation and recording electrodes in the hippocampal slice. b Discharge pattern of CA1 neurons upon depolarizing (500 pA) and hyperpolarizing (−250 pA) current pulses. Scale bars: 50 mV, 200 ms. c Number of generated action potentials (APs) plotted against positive current injection (in pA) in CA1 pyramidal cells of AAV-WT and AAV-Glu-FAAH mice. d, e LTP in CA1 following high-frequency stimulation (HFS, 100 Hz) is significantly enhanced in AAV-Glu-FAAH mice compared to AAV-WT mice (unpaired t test, *p < 0.05). d Inset shows sample EPSC traces at indicated time points before and after HFS, scale bars: 100 pA, 25 ms. f PPI does not change after induction of LTP. g Analysis of the coefficient of variation (CV2) plotted against mean EPSC ratios indicates a presynaptic mechanism involved in LTP in AAV-Glu-FAAH mice and a postsynaptic one in AAV-WT mice. h, i Excitatory LTD (eLTD) at CA3-CA1 synapses following low-frequency stimulation (LFS, 900 paired pulses, 1 Hz) is unchanged in AAV-Glu-FAAH mice compared to AAV-WT mice. h Inset shows sample EPSC traces at indicated time points before and after LFS, scale bars: 100 pA, 25 ms. j PPI does not change after induction of eLTD. k Analysis of CV2 plotted against mean EPSC ratios point to a postynaptic mechanism involved in eLTD in both genotypes. l, m. Both AAV-WT and AAV-Glu-FAAH mice showed intact inhibitory LTD (iLTD) at CA3-CA1 synapses. In (l), inset shows sample IPSC traces at indicated time points before and after HFS, scale bars: 200 pA, 25 ms. n PPI does not change after induction of iLTD. o Analysis of CV2 plotted against mean IPSC ratios indicates a presynaptic mechanism involved in iLTD in mice of both genotypes. In e, i, m, scatter plots and corresponding mean ± SEM represent amplitudes recorded after plasticity induction (LTP and iLTD: min 36–40; eLTD: min 46–50). In c, d, h, l, numbers indicate the number of recorded cells/animals.

