Fig. 4.
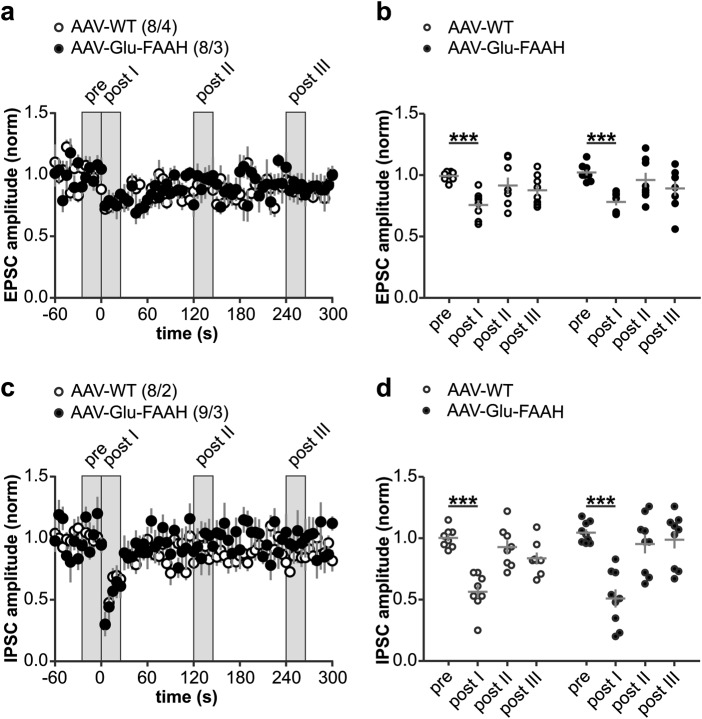
Depolarization-induced suppression of excitation (DSE) and inhibition (DSI) at hippocampal CA3-CA1 synapses. a, c Upon postsynaptic depolarization (−70 to 0 mV, 10 s duration, at time zero), both AAV-WT and AAV-Glu-FAAH mice showed comparable DSE and DSI. Numbers indicate the number of recorded cells/animals. b, d Scatter plot and corresponding mean ± SEM of amplitudes recorded immediately before (pre), immediately after (post I), 2 min (post II) and 4 min after depolarization (post III). Repeated measure-ANOVA, factor time in b: F(3, 42) = 13.22, p < 0.0001, factor time in d: F(3, 45) = 36.88, p < 0.0001, ***p < 0.001 pre vs. post I, by post hoc Bonferroni.

