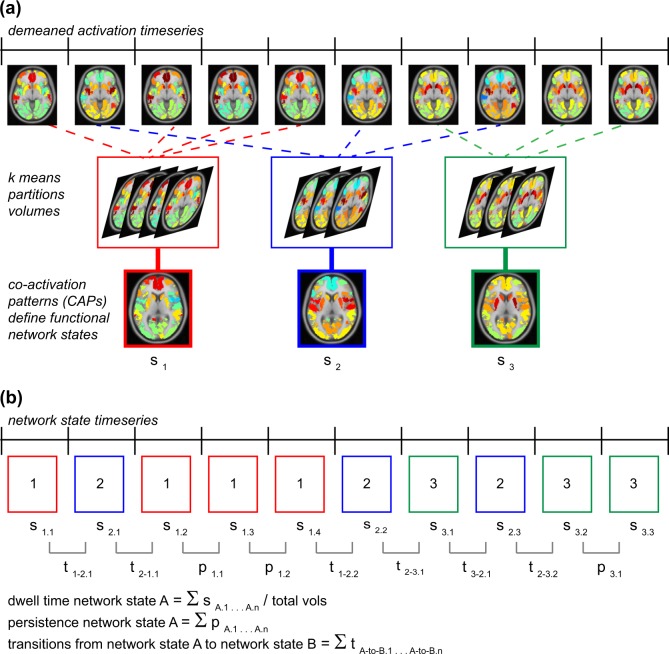
Fig. 1.
Analytic method for evaluating resting-state network dynamics. Displayed are analytic steps used in this study for evaluating resting-state network dynamics using co-activation pattern analysis (CAP [32–34]). a For each participant and each volume of data, activation (relative to the within-participant global mean at that spatial location) was calculated at each of 130 regions of interest using a whole-brain parcellation of cortex and striatum [36, 37] plus subcortical limbic regions as defined by the AAL atlas [38]. This step yielded a data vector of co-activation estimates for each volume at each ROI and for each participant (demeaned activation timeseries). Data vectors were concatenated across volumes and participants, and k-means clustering was used to partition the data into k functional network states that represent recurring patterns of co-activation over time and across participants. b Each volume of data was coded by its categorization in a network state, as defined by the k means analysis, yielding a timeseries for each participant with each volume coded by network state (network state timeseries). The network state timeseries was used to compute measures of network dynamics for each participant, including (1) overall dwell time in a network state: proportion of volumes that the participant spent in that brain state over the scan series (summed volumes in that brain state divided by total number of volumes in the series), (2) persistence of a network state: total (summed) volume-to-volume maintenance of that brain state, and (3) total (summed) frequency of state-to-state transitions from one volume to the next (e.g., frequency of moving from state A to state B)

