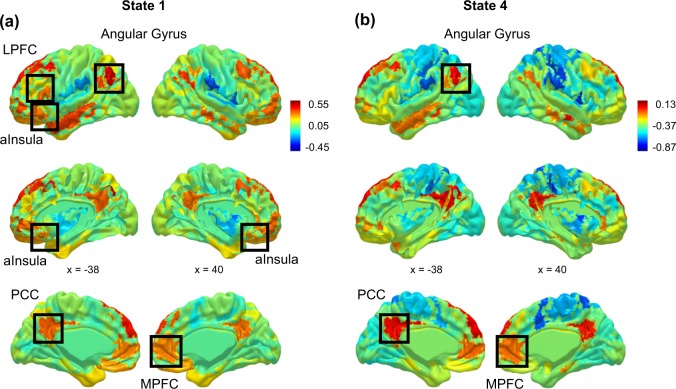
Fig. 2.
Functional brain network states identified using co-activation pattern analysis (CAP). Two brain network states of co-activation identified via CAP analysis, involving areas of frontoinsular cortex and the prototypical default network, were relevant to hypotheses. a State 1 was characterized by relatively higher activation in frontoinsular areas of anterior insula, and lateral and medial prefrontal cortex; and posterior regions of the default network, including posterior cingulate and angular gyrus. b State 4 was characterized by relatively higher activation in regions of the prototypical default network including midline and temporal cortex, and angular gyrus. For other brain network states identified in CAP analysis, see Fig. S1. Note: anterior insula (aInsula), medial prefrontal cortex (MPFC), posterior cingulate cortex (PCC). Network states are normalized to show patterns of activation or deactivation relative to the within-state average; the numeric anchors for the activation scale for each network state show the correspondence between the within-state average and the global average of activation across all brain regions and all volumes of the scan series

