
Fig. 10.
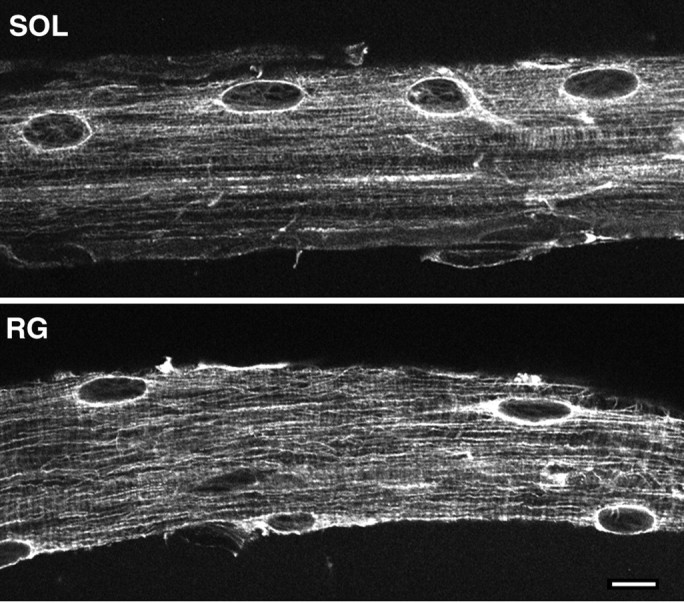
After denervation, the microtubule pattern is similar at the surface of type I and type II fibers. Distribution of the microtubules in denervated soleus (SOL) and red gastrocnemius (RG) fibers. Notice the strong perinuclear staining and the longitudinal microtubules in both. Scale bar, 10 μm.