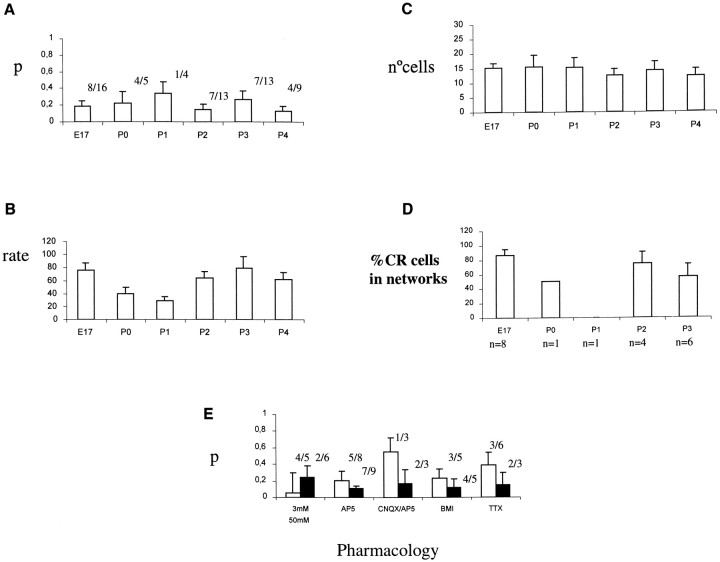
Fig. 6.
Quantification of the spontaneous activity in wild-type hemispheres and pharmacological blockade of the networks.A, Histogram of the degree of correlation (as measured by the p statistic; see Materials and Methods) as a function of age. A lower p indicates a high degree of pairwise correlation. The bars represent the mean p, and the error bars represent the SE. The fraction represents the number of experiments that had significant (p < 0.05) correlations, divided by the total number of experiments. B, Histogram of the activation rate (number of transients/cell/104 sec) as a function of age. The total number of experiments as inA. C, Histogram of the number of active cells as a function of age. D, Histogram of the percentage of the active CR cells that form part of a network, divided by the total number of CR cells. For each age, the number of experiments in which active CR were identified is givenbelow the histogram. E, Pharmacological effects on the networks. Histogram of the average pvalue (as above) under 3 and 50 mm K+ACSF, AP-5 (50 μm), AP-5–CNQX (50–20 μm), BMI (30 μm), and TTX (1 μm). White bars are the mean p value under each test, andblack bars represent control experiments using 50 mm K+ ACSF. The fractionrepresents the number of experiments that had significant (p < 0.05) correlations, divided by the total number of experiments. Note how AP-5, CNQX–AP-5, BMI, and TTX increase the average p value (i.e., decorrelate the networks).

