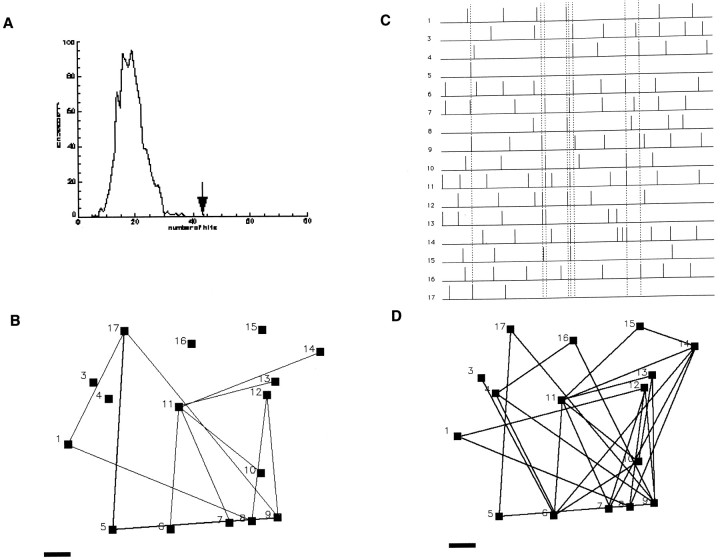
Fig. 8.
Networks of CR and NCR cells in reeler layer 1.A, Distribution of pairwise correlations found in the real (arrow) and simulated data set from Figure 7. The number of correlated events in the real data set is higher than the tail of the gaussian distribution obtained with 1000 Monte Carlo simulations (see Materials and Methods). B, Correlation map of cells imaged in Figure 7. C, Raster plot of an experiment marking groups of cells that fire simultaneously (dotted lines). D, Correlation map based on the groups of cells firing simultaneously in C. Note how CR cell 12 is correlated with NCR cells. Scale bar, 10 μm.

