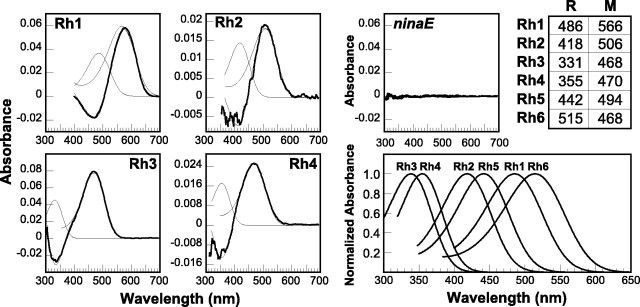
Fig. 5.
Spectroscopy of the DrosophilaRh1–Rh4 visual pigments. Left, Middle, Difference spectra that were measured from digitonin extracts of flies expressing Rh1, Rh3, and Rh4 andninaE17 mutant controls and MSP of flies expressing Rh2 are shown. In each case the difference spectra were calculated from spectra measured after illumination with adapting lights (using a single-adapting light and subtracting from the dark-adapted state or with λ1 and λ2 as described above), which were 461 nm (for Rh1), 418 and 524 nm (for Rh2), 344 nm (for Rh3), 384 nm (for Rh4), and 560 and 442 nm (forninaE). Difference spectra reflecting the R → M conversion were generated from flies expressing Rh1–Rh4; however no difference spectrum was generated from theninaE17 mutant host strain. Each difference spectrum (boldtrace in eachpanel) was fit with calculated rhodopsin and metarhodopsin absorption profiles as described in Materials and Methods (curve fits of the difference spectrum and the R- and M-forms are shown as finetraces in eachpanel). Table, TopRight, The calculated absorption maxima of the R- and M-forms for each pigment are indicated. The r values for the fits and the ratio of the R- and M-form extinctions λmax were as follows: Rh1, r = 0.996 and R/M = 1:1.6; Rh2, r = 0.0.987 and R/M = 1:1.5; Rh3, r = 0.998 and R/M = 1:1.7; and Rh4, r = 0.997 and R/M = 1:1.5.BottomRight, The calculated rhodopsin α-band absorptions based on the absorption maxima listed in thetable are shown. As discussed in the text, the calculated R- and M-form absorption maxima differ somewhat between the different measurement methods. Difference spectroscopy would be expected to yield a fairly accurate estimate of M-form absorption, because its extinction coefficient is greater than that of the R-form. In the absence of waveguide or self-screening effects, the spectral sensitivity measured physiologically would be expected to yield a fairly accurate estimate of the R-form absorption. For reference, the maximal sensitivities of flies expressing Rh1–Rh6 are 478 nm (Rh1), 420 nm (Rh2), 345 nm (Rh3), 375 nm (Rh4), 437 nm (Rh5), and 508 nm (Rh6) (Feiler et al., 1988, 1992; this paper).

