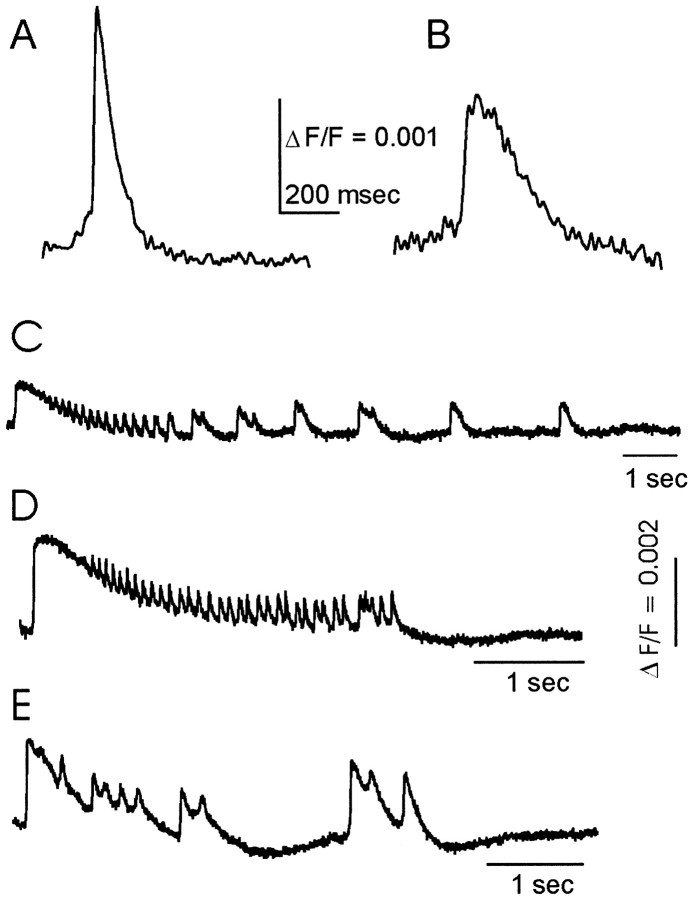
Fig. 1.
Optical recordings of interictal- and ictal-like discharges. A, B, Interictal-like discharge in an induced slice (A; previous bursting in low-Cl− ACSF) and a disinhibited slice (B; with 10 μm bicuculline).C–E, Ictal-like discharges in anterior (C), intermediate (D), and posterior (E) PC slices. All fluorescence (F) traces represent averages of six neighboring detectors. Note that the instrumentation uses a high-pass filter with a 500 msec time constant (see Materials and Methods), and this produces some attenuation of the longer events ofC–E. Stimulus was applied to layer Ib of the PC in alltraces; stimulus currents were 175 μA (A), 65 μA (B), 250 μA (C), 275 μA (D), and 60 μA (E).

