
Fig. 4.
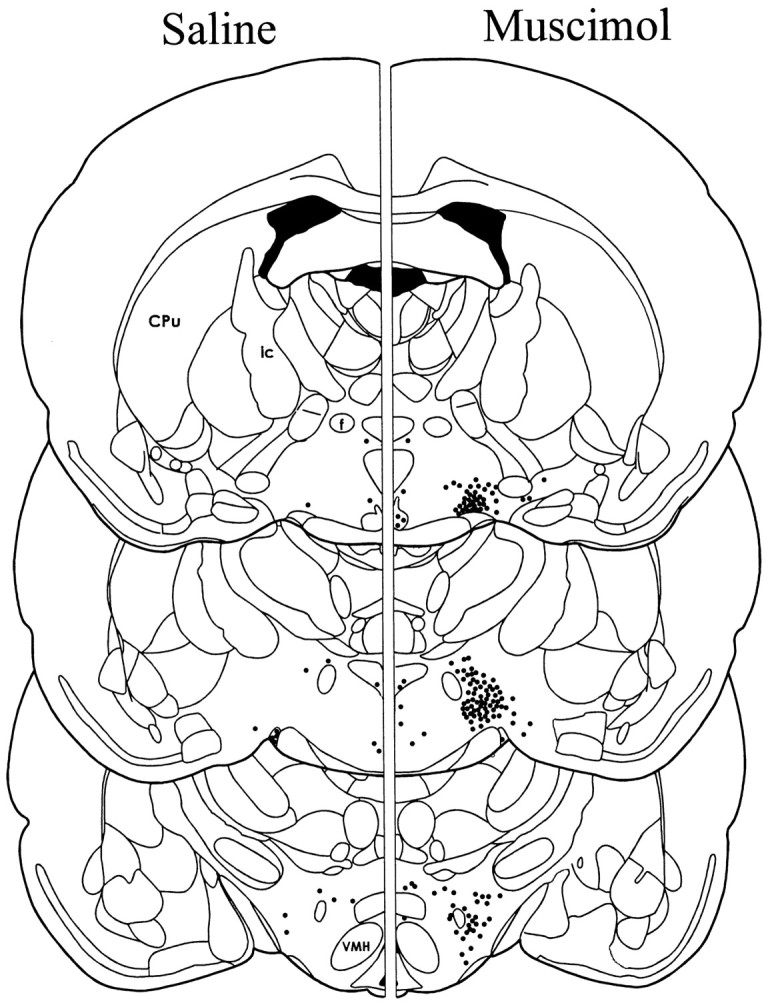
Schematic illustration of the mean number and location of cells exhibiting Fos-LI at three levels of the LH. Theleft depicts Fos-LI after injection of saline into the AcbSh, and the right depicts Fos-LI after injection of muscimol into the AcbSh. Each dot represents approximately five labeled cells. The mean ± SEM number of hypothalamic cells exhibiting Fos-LI on one side of the brain at each level are as follows: rostral LH: saline 35 ± 6, muscimol 377 ± 50; middle LH: saline 24 ± 3, muscimol 692 ± 63; caudal LH: saline 49 ± 6, muscimol 322 ± 40.Cpu, Caudate putamen; VMH, ventromedial hypothalamic nucleus; ic, internal capsule;f, fornix.