
Fig. 3.
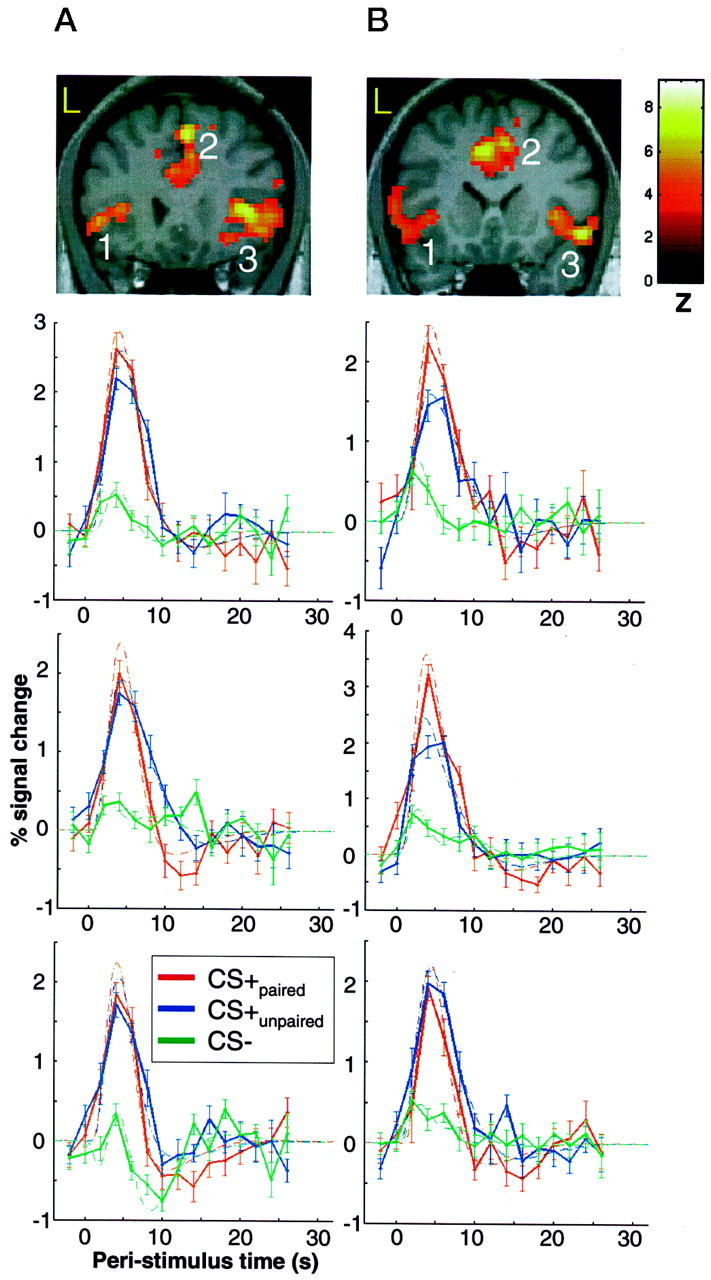
Significant differential visual evoked responses for CS+ versus CS− tones in the anterior cingulate cortex and the right and left insulae for two individual subjects (subject 5 inA and subject 6 in B). The coronal slice of the subject's individual T1-weighted MRI shows the location of differential responses. Images are thresholded at p< 0.001 uncorrected for visualization. The significance for individual activations are given in Table 1. The peristimulus time plots are shown for all three regions. The fitted response and the adjusted data (±SEM) are plotted for 2 sec time bins. Although responses are shown for CS+paired, CS+unpaired, and CS−, the statistical inference is based on the difference between CS+unpaired and CS−.