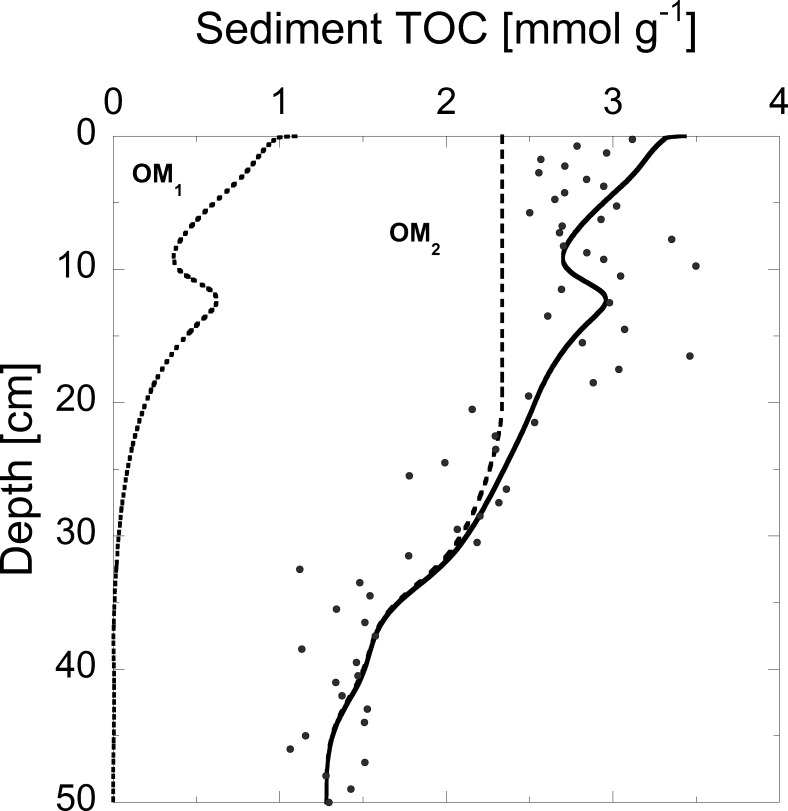
Fig 4. Vertical profiles of measured (dots) and simulated (line) TOC concentrations (2015).
Simulated concentrations are further split up into reactive OM1 (dotted) and non-reactive OM2 (dashed) TOC pools. The “bump” in the modeled TOC concentration between 10 and 15 cm depth is caused by the onset of artificial aeration in 1982.

