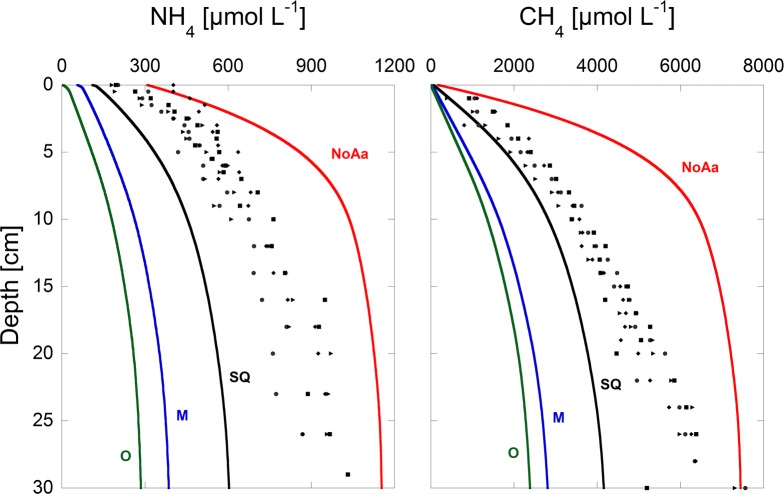
Fig 5. Modeled CH4 and NH4 porewater concentrations for the year 2050.
The colored lines represent results for the different scenarios: red (no artificial aeration), black (status quo), blue (mesotrophic) and green (oligotrophic). In comparison, the porewater concentrations measured in the year 2015 are plotted with black dots.

