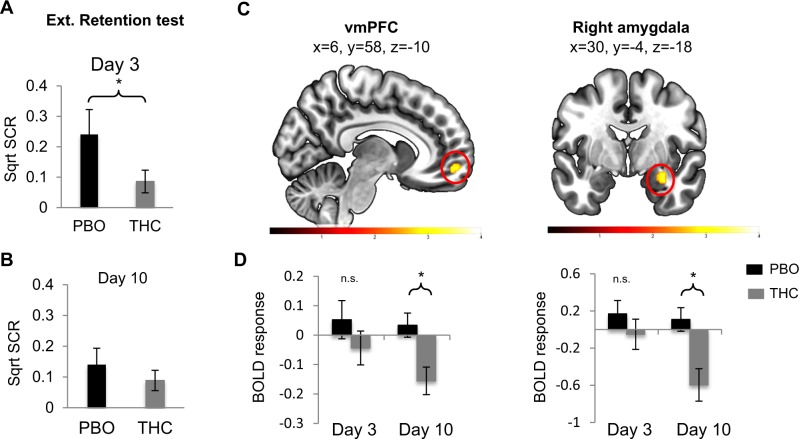
Fig. 3.
Skin conductance response and BOLD response during the first and second extinction memory tests (Day 3 and Day 10). a, b The retention test is calculated by subtracting the average SCR to the first 4 trials in the extinction memory tests from the average SCR to the last 4 trials of extinction. a Retention index shows significantly blunted return of fear on Day 3 in the THC group compared to the PBO group. *p < 0.05. b No significant group difference in retention index on Day 10. Bar graph showing mean+/− standard error. c BOLD signal for the early (first 5 trials) CS+E vs. early CS+U during extinction memory tests on Day 3 and Day 10. Results show significant group difference only on Day 10 in the following regions: vmPFC (left) and right amygdala (right). Color bars represent t-maps. d Extracted average beta-weights (and standard errors) from the significant cluster for the early CS+E vs. early CS+U contrast. Only regions with significant group differences that survive small volume correction are displayed. n(PBO) = 20 and n(THC) = 20 on Day 3, and 17 Day 10. (Ext., extinction; vmPFC, ventromedial prefrontal cortex). *p < 0.05

