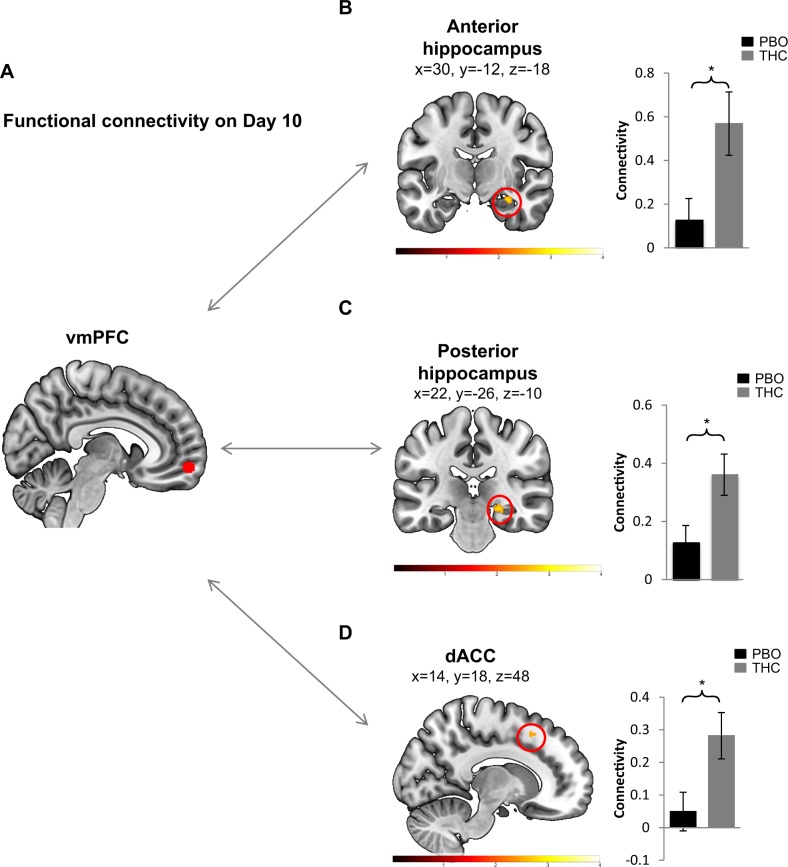
Fig. 4.
a Ventromedial prefrontal cortex (vmPFC) region (obtained from the between-group contrast shown in Fig. 3c) used as a seed for the psychophysiological interactions (PPI) during extinction memory test on Day 10. b–d Regions of connectivity, t-map color bar, along with bar graphs representing extracted average beta-weights (and standard error) that show the direction of connectivity. Only regions with significant differences between groups are shown. n(PBO) = 20 and n(THC) = 17. *p < 0.05

