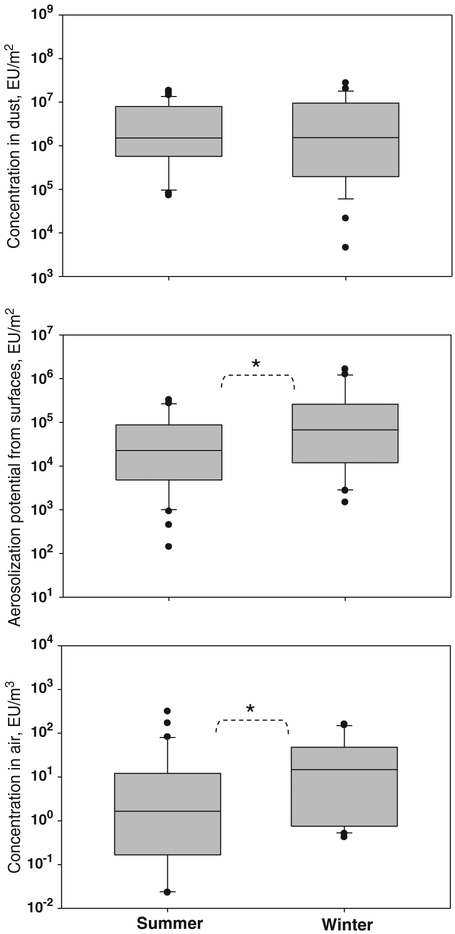
Fig. 1.
Exposure matrices of endotoxin in flood-affected homes (n=35 in summer and 31 in winter). The lower and upper boundaries of the box specify the 25th and 75th percentiles, respectively. The line within the box indicates the median and the whiskers above and below the box indicate the 95th and 5th percentiles, respectively. * indicates statistically significant difference (paired t-test: p<0.05).

