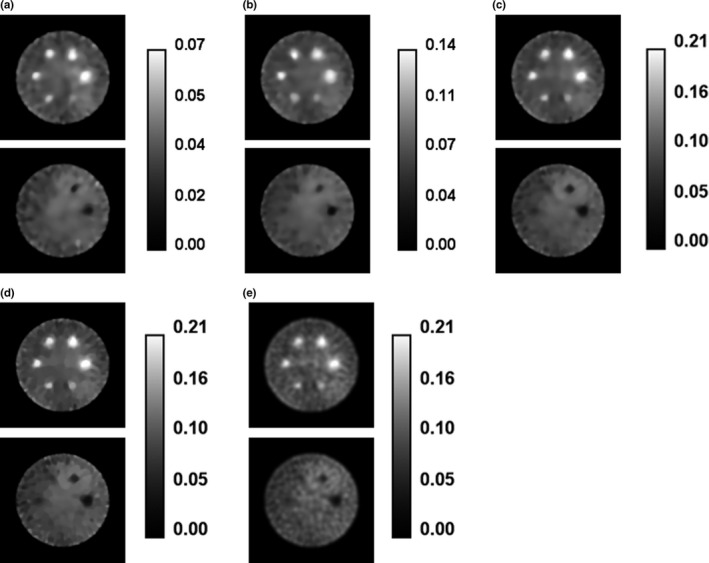
Figure 2.

Transaxial cross‐sections of images for Monte Carlo‐simulated SPECT data for phantom shown in Fig. 1, reconstructed by: (a) the ICTV‐PAPA method for 40 kc/view data, λ 1 = 0.4, λ 2 = 0.4; (b) the ICTV‐PAPA method for 80 kc/view data, λ 1 = 0.3, λ 2 = 0.3; (c) the ICTV‐PAPA method for 120 kc/view data, λ 1 = 0.2, λ 2 = 0.2; (d) the TV‐PAPA method for 120 kc/view data, λ = 0.2; and (e) the GPF‐MLEM method using 120 kc/view data, FWHM = 7.3 mm. For all images, reconstructions were stopped at 100 iterations. Left column: hot spheres with Gaussian activity distribution (see text). Right column: cold spheres with zero activity.
