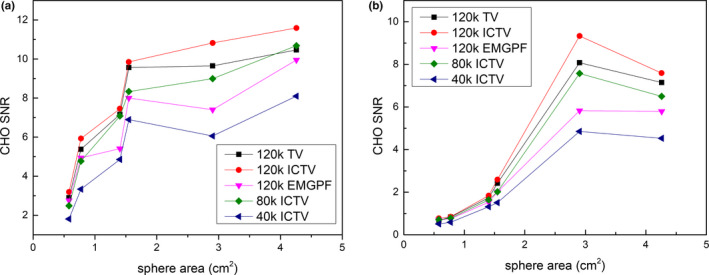
Figure 7.

CHO detectability indices of (a) hot; and (b) cold spheres vs. cross‐sectional area of the spheres and vs. the number of counts per view in the simulated SPECT data. The ICTV‐PAPA method for 40 kc/view data, λ 1 = 0.4, λ 2 = 0.4; the ICTV‐PAPA method for 80 kc/view data, λ 1 = 0.3, λ 2 = 0.3; the ICTV‐PAPA method for 120 kc/view data, λ 1 = 0.2, λ 2 = 0.2; the TV‐PAPA method for 120 kc/view data, λ = 0.2; and the GPF‐MLEM method using 120 kc/view data, FWHM = 7.3 mm. The reconstructions were stopped at 100 iterations. The solid lines connecting the data points are provided as a visual guide only. [Color figure can be viewed at wileyonlinelibrary.com]
